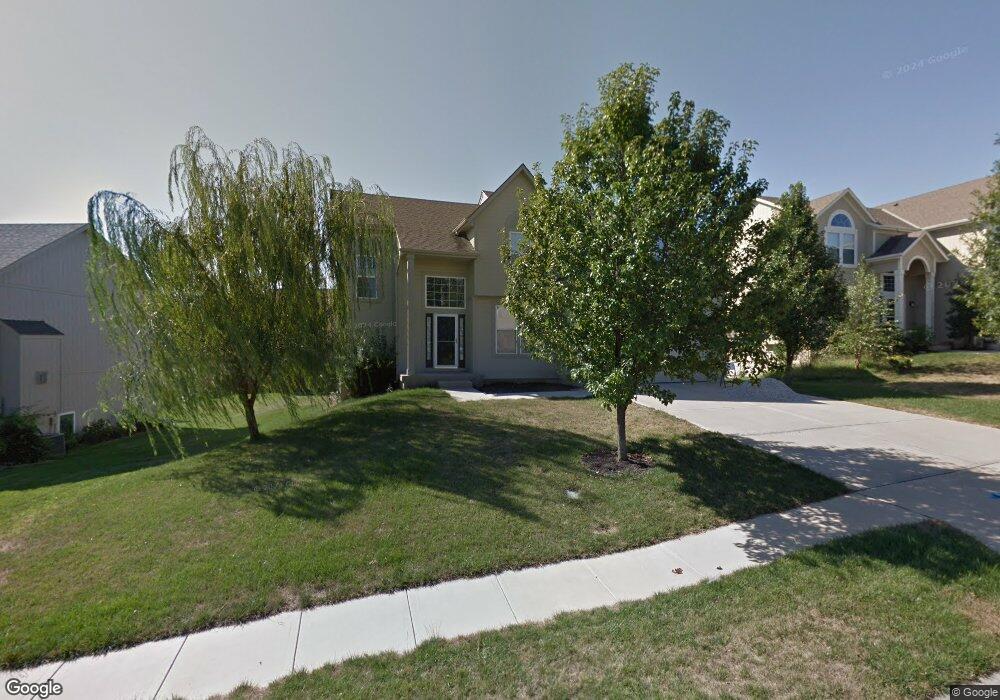
21005 W 53rd Terrace Shawnee, KS 66218
Estimated Value: $450,000 - $502,000
4
Beds
3
Baths
2,342
Sq Ft
$201/Sq Ft
Est. Value
About This Home
This home is located at 21005 W 53rd Terrace, Shawnee, KS 66218 and is currently estimated at $471,890, approximately $201 per square foot. 21005 W 53rd Terrace is a home located in Johnson County with nearby schools including Clear Creek Elementary School, Monticello Trails Middle School, and Mill Valley High School.
Ownership History
Date
Name
Owned For
Owner Type
Purchase Details
Closed on
Jan 13, 2021
Sold by
Malkiat Singh
Bought by
Amarjit Kaur
Current Estimated Value
Purchase Details
Closed on
Jun 10, 2004
Sold by
Premier Homes Inc
Bought by
Singh Malkiat
Home Financials for this Owner
Home Financials are based on the most recent Mortgage that was taken out on this home.
Original Mortgage
$175,160
Interest Rate
4.87%
Mortgage Type
New Conventional
Purchase Details
Closed on
Sep 19, 2003
Sold by
Millcreek Meadows Llc
Bought by
Premier Homes Inc
Home Financials for this Owner
Home Financials are based on the most recent Mortgage that was taken out on this home.
Original Mortgage
$187,000
Interest Rate
6.22%
Mortgage Type
Construction
Create a Home Valuation Report for This Property
The Home Valuation Report is an in-depth analysis detailing your home's value as well as a comparison with similar homes in the area
Home Values in the Area
Average Home Value in this Area
Purchase History
| Date | Buyer | Sale Price | Title Company |
|---|---|---|---|
| Amarjit Kaur | -- | None Available | |
| Kaur Amarjit | -- | None Listed On Document | |
| Singh Malkiat | -- | Security Land Title Company | |
| Premier Homes Inc | -- | Security Land Title Company |
Source: Public Records
Mortgage History
| Date | Status | Borrower | Loan Amount |
|---|---|---|---|
| Previous Owner | Singh Malkiat | $175,160 | |
| Previous Owner | Premier Homes Inc | $187,000 | |
| Closed | Singh Malkiat | $21,895 |
Source: Public Records
Tax History Compared to Growth
Tax History
| Year | Tax Paid | Tax Assessment Tax Assessment Total Assessment is a certain percentage of the fair market value that is determined by local assessors to be the total taxable value of land and additions on the property. | Land | Improvement |
|---|---|---|---|---|
| 2024 | $5,442 | $46,828 | $8,221 | $38,607 |
| 2023 | $5,402 | $45,942 | $8,221 | $37,721 |
| 2022 | $4,953 | $41,274 | $7,150 | $34,124 |
| 2021 | $4,609 | $36,903 | $6,496 | $30,407 |
| 2020 | $4,304 | $34,143 | $6,496 | $27,647 |
| 2019 | $4,367 | $34,143 | $5,904 | $28,239 |
| 2018 | $4,103 | $31,786 | $5,904 | $25,882 |
| 2017 | $3,972 | $30,015 | $5,361 | $24,654 |
| 2016 | $3,943 | $29,429 | $5,112 | $24,317 |
| 2015 | $3,812 | $27,980 | $5,112 | $22,868 |
| 2013 | -- | $26,151 | $5,112 | $21,039 |
Source: Public Records
Map
Nearby Homes
- 5405 Lakecrest Dr
- 5311 Brownridge Dr
- 21217 W 55th Terrace
- 5307 Noble St
- 21309 W 56th St
- 21624 W 53rd Terrace
- 21315 W 56th St
- 5725 Marion St
- 5015 Millbrook St
- 21804 W 52nd Terrace
- 21408 W 50th St
- 5817 Millbrook St
- 5206 Round Prairie St
- 5900 Redbud St
- 21222 W 48th St
- 5402 Roundtree St
- 4754 Lakecrest Dr
- 22115 W 51st Terrace
- 5116 Payne St
- 22014 W 51st St
- 21009 W 53rd Terrace
- 20915 W 53rd Terrace
- 21010 W 54th St
- 21006 W 54th St
- 21103 W 53rd Terrace
- 20907 W 53rd Terrace
- 21006 W 53rd Terrace
- 21002 W 53rd Terrace
- 21014 W 54th St
- 21104 W 53rd Terrace
- 20914 W 53rd Terrace
- 21109 W 53rd Terrace
- 21002 W 54th St
- 20910 W 53rd Terrace
- 21102 W 54th St
- 20903 W 53rd Terrace
- 21112 W 53rd Terrace
- 21007 W 53rd St
- 21105 W 53rd St
- 21003 W 53rd St