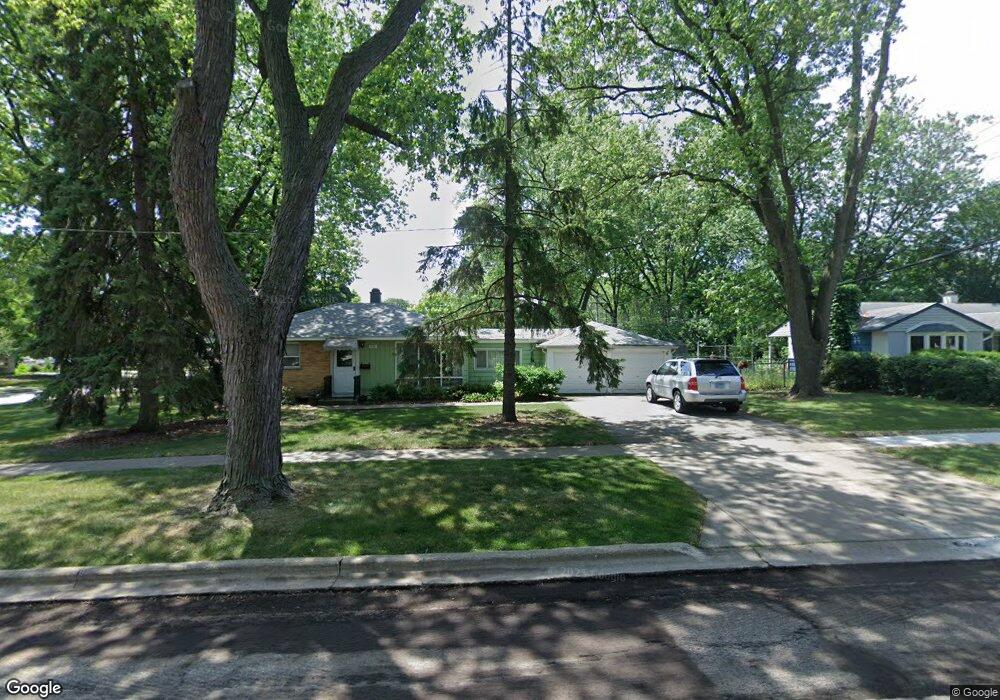
2101 Sigwalt St Rolling Meadows, IL 60008
Estimated Value: $254,000 - $300,000
2
Beds
1
Bath
861
Sq Ft
$319/Sq Ft
Est. Value
About This Home
This home is located at 2101 Sigwalt St, Rolling Meadows, IL 60008 and is currently estimated at $274,488, approximately $318 per square foot. 2101 Sigwalt St is a home located in Cook County with nearby schools including Kimball Hill Elementary School, King Elementary School, and Carl Sandburg Junior High School.
Ownership History
Date
Name
Owned For
Owner Type
Purchase Details
Closed on
Mar 21, 2016
Sold by
Florey Sharon J and Florey Sharon J
Bought by
Chicago Title Land Trust Co
Current Estimated Value
Purchase Details
Closed on
Feb 3, 2016
Sold by
Chicago Title Land Trust Company
Bought by
Florey Sharon J
Purchase Details
Closed on
May 1, 2014
Sold by
Florey Sharon J
Bought by
Chicago Title Land Trust Company and Trust #8002364638
Create a Home Valuation Report for This Property
The Home Valuation Report is an in-depth analysis detailing your home's value as well as a comparison with similar homes in the area
Home Values in the Area
Average Home Value in this Area
Purchase History
| Date | Buyer | Sale Price | Title Company |
|---|---|---|---|
| Chicago Title Land Trust Co | -- | Chicago Title Insurance Comp | |
| Florey Sharon J | -- | Chicago Title Land Trust Co | |
| Chicago Title Land Trust Company | -- | Chicago Title Land Trust Co |
Source: Public Records
Tax History Compared to Growth
Tax History
| Year | Tax Paid | Tax Assessment Tax Assessment Total Assessment is a certain percentage of the fair market value that is determined by local assessors to be the total taxable value of land and additions on the property. | Land | Improvement |
|---|---|---|---|---|
| 2024 | $2,188 | $22,000 | $5,511 | $16,489 |
| 2023 | $2,162 | $22,000 | $5,511 | $16,489 |
| 2022 | $2,162 | $22,000 | $5,511 | $16,489 |
| 2021 | $2,375 | $16,826 | $3,256 | $13,570 |
| 2020 | $2,161 | $16,826 | $3,256 | $13,570 |
| 2019 | $2,149 | $18,800 | $3,256 | $15,544 |
| 2018 | $2,397 | $15,659 | $3,006 | $12,653 |
| 2017 | $2,307 | $15,659 | $3,006 | $12,653 |
| 2016 | $2,904 | $15,659 | $3,006 | $12,653 |
| 2015 | $3,249 | $14,852 | $2,755 | $12,097 |
| 2014 | $3,105 | $14,852 | $2,755 | $12,097 |
| 2013 | $3,103 | $14,852 | $2,755 | $12,097 |
Source: Public Records
Map
Nearby Homes
- 1615 W Johanna Terrace
- 502 S Reuter Dr
- 2611 South St
- 2201 Kingfisher Ln
- 12 S Princeton Ct
- 2100 Martin Ln
- 3208 Wren Ln
- 222 S Dwyer Ave
- 3316 Trillium Cir
- 617 N Wilke Rd
- 3125 Town Square Dr Unit 408
- 3805 Wren Ln
- 3265 Kirchoff Rd Unit 223
- 3400 Wellington Ct Unit 306
- 3355 Kirchoff Rd Unit 6A
- 751 S Dwyer Ave Unit F
- 1506 W Northwest Hwy
- 2303 Fulle St
- 1602 W Orchard Place Unit 1602C
- 2503 Fulle St Unit 17