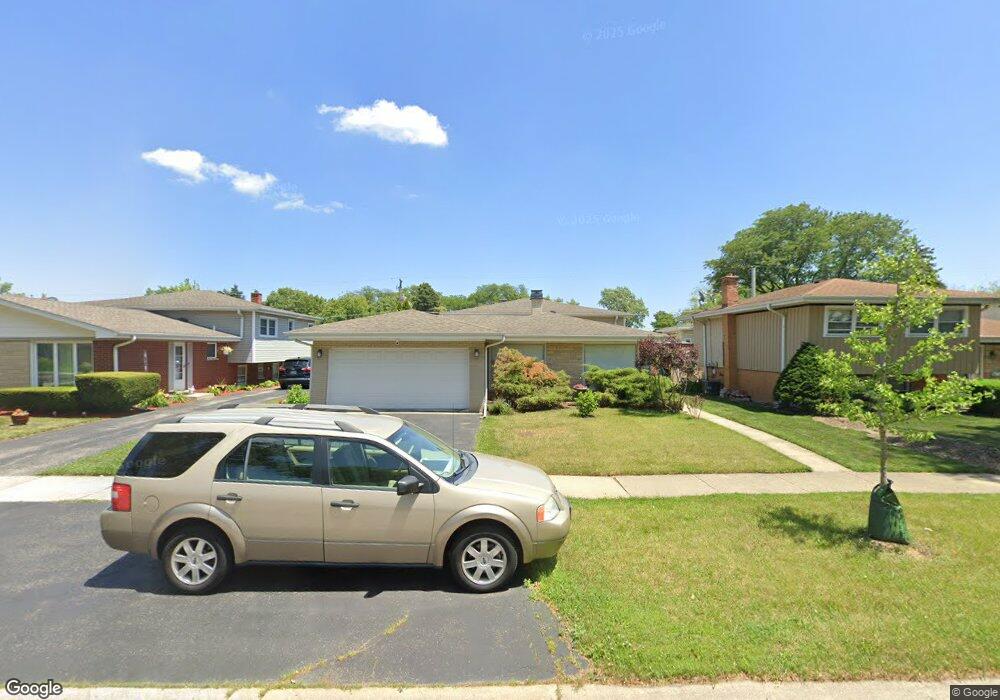
2101 Webster Ln Unit 3 Des Plaines, IL 60018
Estimated Value: $448,857 - $488,000
4
Beds
3
Baths
1,621
Sq Ft
$289/Sq Ft
Est. Value
About This Home
This home is located at 2101 Webster Ln Unit 3, Des Plaines, IL 60018 and is currently estimated at $469,214, approximately $289 per square foot. 2101 Webster Ln Unit 3 is a home located in Cook County with nearby schools including Plainfield Elementary School, Algonquin Middle School, and Maine West High School.
Ownership History
Date
Name
Owned For
Owner Type
Purchase Details
Closed on
Sep 16, 1997
Sold by
Bojanowski Janice
Bought by
Kosinski Mark and Kosinski Korey Lucy
Current Estimated Value
Home Financials for this Owner
Home Financials are based on the most recent Mortgage that was taken out on this home.
Original Mortgage
$100,000
Outstanding Balance
$15,716
Interest Rate
7.63%
Estimated Equity
$453,498
Purchase Details
Closed on
Jun 15, 1995
Sold by
Mattox Maribeth and Puklavetz John
Bought by
Bojanowski Janice
Home Financials for this Owner
Home Financials are based on the most recent Mortgage that was taken out on this home.
Original Mortgage
$130,000
Interest Rate
7.25%
Purchase Details
Closed on
Feb 7, 1995
Sold by
Mattox Maribeth and Puklavetz James
Bought by
Mattox Maribeth and Puklavetz John
Create a Home Valuation Report for This Property
The Home Valuation Report is an in-depth analysis detailing your home's value as well as a comparison with similar homes in the area
Home Values in the Area
Average Home Value in this Area
Purchase History
| Date | Buyer | Sale Price | Title Company |
|---|---|---|---|
| Kosinski Mark | $140,000 | -- | |
| Bojanowski Janice | $195,000 | Attorneys Natl Title Network | |
| Mattox Maribeth | -- | -- |
Source: Public Records
Mortgage History
| Date | Status | Borrower | Loan Amount |
|---|---|---|---|
| Open | Kosinski Mark | $100,000 | |
| Previous Owner | Bojanowski Janice | $130,000 |
Source: Public Records
Tax History Compared to Growth
Tax History
| Year | Tax Paid | Tax Assessment Tax Assessment Total Assessment is a certain percentage of the fair market value that is determined by local assessors to be the total taxable value of land and additions on the property. | Land | Improvement |
|---|---|---|---|---|
| 2024 | $8,233 | $34,541 | $7,000 | $27,541 |
| 2023 | $8,008 | $34,541 | $7,000 | $27,541 |
| 2022 | $8,008 | $34,541 | $7,000 | $27,541 |
| 2021 | $7,223 | $26,829 | $4,550 | $22,279 |
| 2020 | $7,170 | $26,829 | $4,550 | $22,279 |
| 2019 | $7,190 | $30,146 | $4,550 | $25,596 |
| 2018 | $6,236 | $24,288 | $4,025 | $20,263 |
| 2017 | $6,144 | $24,288 | $4,025 | $20,263 |
| 2016 | $6,725 | $26,699 | $4,025 | $22,674 |
| 2015 | $6,477 | $24,048 | $3,500 | $20,548 |
| 2014 | $6,357 | $24,048 | $3,500 | $20,548 |
| 2013 | $6,181 | $24,048 | $3,500 | $20,548 |
Source: Public Records
Map
Nearby Homes
- 2025 Plainfield Dr
- 2181 Plainfield Dr
- 2209 Douglas Ave
- 614 Birchwood Ave
- 2358 Westview Dr
- 2243 S Wolf Rd
- 2131 Ash St Unit G
- 1783 Lee St
- 2017 Pine St Unit B
- 807 Fairmont Ct
- 773 E Lincoln Ave
- 1050 E Oakton St
- 991 Wicke Ave
- 1724 Illinois St
- 1689 S Elm St
- 1394 Carol Ln
- 1632 S Elm St
- 1596 Oxford Rd
- 1629 E Touhy Ave
- 505 Forest Ave
- 2081 Webster Ln
- 2109 Webster Ln
- 2073 Webster Ln
- 2117 Webster Ln
- 2100 Eastview Dr
- 2108 Eastview Dr
- 2080 Eastview Dr
- 2116 Eastview Dr
- 2125 Webster Ln
- 2065 Webster Ln
- 2072 Eastview Dr
- 2100 Webster Ln Unit 3
- 2080 Webster Ln
- 2124 Eastview Dr
- 2064 Eastview Dr
- 2072 Webster Ln
- 2133 Webster Ln
- 2116 Webster Ln
- 2057 Webster Ln
- 2132 Eastview Dr