Estimated Value: $1,058,000 - $2,212,000
2
Beds
1
Bath
796
Sq Ft
$2,277/Sq Ft
Est. Value
About This Home
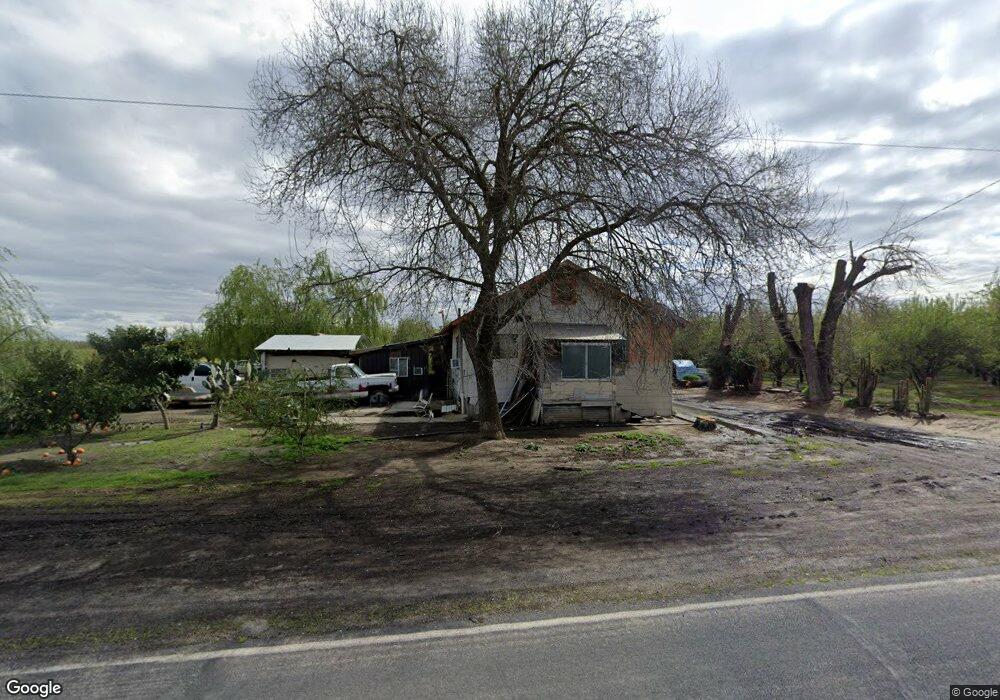
This home is located at 21010 S Wagner Ave, Ripon, CA 95366 and is currently estimated at $1,812,556, approximately $2,277 per square foot. 21010 S Wagner Ave is a home located in San Joaquin County with nearby schools including Colony Oak Elementary School, Park View Elementary School, and Ripona Elementary School.
Ownership History
Date
Name
Owned For
Owner Type
Purchase Details
Closed on
Mar 4, 2025
Sold by
Kamps Family 2003 Revocable Trust and Kamps Robert L
Bought by
Rs Kamps Family Lp
Current Estimated Value
Purchase Details
Closed on
Jun 15, 2012
Sold by
Weststeyn Michael J and Weststeyn Amy M
Bought by
Weststeyn Michael J and Weststeyn Amy M
Purchase Details
Closed on
Oct 7, 2008
Sold by
Vanvuren Elaine
Bought by
Hollander Charles A and Hollander Janice E
Purchase Details
Closed on
Oct 20, 2004
Sold by
Hollander Charles A and Hollander Janice E
Bought by
Hollander Charles A and Hollander Janice E
Purchase Details
Closed on
Mar 16, 2001
Sold by
De Jong Margaret Tr
Bought by
Hollander Janice E
Purchase Details
Closed on
Oct 9, 2000
Sold by
De Jong Margaret Tr
Bought by
Hollander Janice E
Create a Home Valuation Report for This Property
The Home Valuation Report is an in-depth analysis detailing your home's value as well as a comparison with similar homes in the area
Purchase History
| Date | Buyer | Sale Price | Title Company |
|---|---|---|---|
| Rs Kamps Family Lp | -- | None Listed On Document | |
| Weststeyn Michael J | -- | None Available | |
| Hollander Charles A | $880,000 | Placer Title Company | |
| Hollander Charles A | -- | -- | |
| Hollander Charles A | -- | -- | |
| Hollander Charles A | -- | -- | |
| Hollander Janice E | -- | -- | |
| Hollander Charles A | -- | -- | |
| Hollander Janice E | -- | -- | |
| Hollander Charles A | -- | -- |
Source: Public Records
Tax History
| Year | Tax Paid | Tax Assessment Tax Assessment Total Assessment is a certain percentage of the fair market value that is determined by local assessors to be the total taxable value of land and additions on the property. | Land | Improvement |
|---|---|---|---|---|
| 2025 | $12,575 | $946,794 | $688,466 | $258,328 |
| 2024 | $12,084 | $928,230 | $674,967 | $253,263 |
| 2023 | $11,314 | $910,031 | $661,733 | $248,298 |
| 2022 | $10,592 | $892,193 | $648,758 | $243,435 |
| 2021 | $10,442 | $874,699 | $636,038 | $238,661 |
| 2020 | $10,354 | $865,731 | $629,517 | $236,214 |
| 2019 | $10,191 | $848,756 | $617,174 | $231,582 |
| 2018 | $10,045 | $832,115 | $605,073 | $227,042 |
| 2017 | $9,865 | $815,801 | $593,209 | $222,592 |
| 2016 | $9,714 | $799,808 | $581,580 | $218,228 |
| 2014 | $6,746 | $619,428 | $561,632 | $57,796 |
Source: Public Records
Map
Nearby Homes
- 18650 E Eugenia Ave
- 1720 Fairway Oaks Ct
- 1234 Murphy Rd
- 2345 Murphy Rd
- 17576 E State Highway 120
- 1842 Flagstone Dr
- 749 Nancy Dr
- 0 Murphy Rd Unit 225148414
- 788 E Milgeo Ave
- 243 John Kamps Way
- 183 Haller Ct
- 1537 Atlantic Ave
- 1678 Calhoun Ave
- 163 Franklin Ln
- 848 W Santos Ave
- 845 Sunrise Ave
- 244 California St
- 565 Bodeson Ct
- 446 Meyenberg Ave
- 17230 E Franscella Ln
- 21021 S Wagner Ave
- 21021 S Wagner Ave
- 21355 S Wagner Ave
- 21161 S Wagner Ave
- 20699 S Wagner Ave
- 20578 S Wagner Ave
- 17722 E Eugenia Ave
- 17553 E Eugenia Ave
- 18558 Mello Rd
- 21673 S Wagner Ave
- 21673 S Wagner Ave
- 17572 Mello Rd
- 17536 E Eugenia Ave
- 18181 Mello Rd
- 21551 S Wagner Ave
- 20469 S Wagner Ave
- 18660 Mello Rd
- 21588 S Wagner Ave
- 18149 E River Rd
- 18225 E River Rd
Your Personal Tour Guide
Ask me questions while you tour the home.