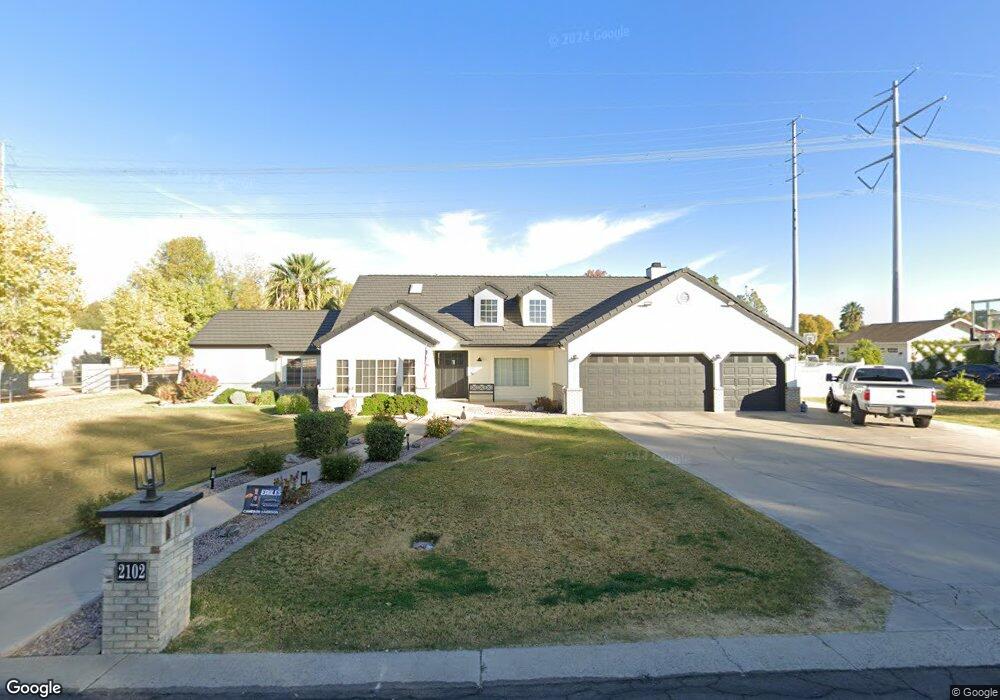
2102 E Vaughn Ave Gilbert, AZ 85234
Val Vista NeighborhoodEstimated Value: $888,000 - $1,290,000
5
Beds
4
Baths
3,610
Sq Ft
$317/Sq Ft
Est. Value
About This Home
This home is located at 2102 E Vaughn Ave, Gilbert, AZ 85234 and is currently estimated at $1,142,943, approximately $316 per square foot. 2102 E Vaughn Ave is a home located in Maricopa County with nearby schools including Sonoma Ranch Elementary School, Greenfield Junior High School, and Gilbert Arts Academy.
Ownership History
Date
Name
Owned For
Owner Type
Purchase Details
Closed on
Dec 22, 2015
Sold by
Krahenbuhl Jolene
Bought by
Garrison Jacob and Garrison Lindsey
Current Estimated Value
Home Financials for this Owner
Home Financials are based on the most recent Mortgage that was taken out on this home.
Original Mortgage
$416,000
Outstanding Balance
$329,969
Interest Rate
3.96%
Mortgage Type
New Conventional
Estimated Equity
$812,974
Purchase Details
Closed on
Jun 27, 2006
Sold by
Corral Henry G and Corral Christina O
Bought by
Krahenbuhl Jolene
Purchase Details
Closed on
Nov 17, 2001
Sold by
Payne Von L and Payne Julie A
Bought by
Corral Henry G and Corral Christina O
Home Financials for this Owner
Home Financials are based on the most recent Mortgage that was taken out on this home.
Original Mortgage
$323,900
Interest Rate
6.57%
Mortgage Type
New Conventional
Create a Home Valuation Report for This Property
The Home Valuation Report is an in-depth analysis detailing your home's value as well as a comparison with similar homes in the area
Home Values in the Area
Average Home Value in this Area
Purchase History
| Date | Buyer | Sale Price | Title Company |
|---|---|---|---|
| Garrison Jacob | $520,000 | American Title Svc Agency Ll | |
| Krahenbuhl Jolene | $710,000 | Lawyers Title Insurance Corp | |
| Corral Henry G | $360,000 | Security Title Agency |
Source: Public Records
Mortgage History
| Date | Status | Borrower | Loan Amount |
|---|---|---|---|
| Open | Garrison Jacob | $416,000 | |
| Previous Owner | Corral Henry G | $323,900 |
Source: Public Records
Tax History
| Year | Tax Paid | Tax Assessment Tax Assessment Total Assessment is a certain percentage of the fair market value that is determined by local assessors to be the total taxable value of land and additions on the property. | Land | Improvement |
|---|---|---|---|---|
| 2025 | $4,005 | $50,722 | -- | -- |
| 2024 | $3,858 | $48,307 | -- | -- |
| 2023 | $3,858 | $71,110 | $14,220 | $56,890 |
| 2022 | $3,736 | $54,080 | $10,810 | $43,270 |
| 2021 | $3,885 | $53,760 | $10,750 | $43,010 |
| 2020 | $3,818 | $52,120 | $10,420 | $41,700 |
| 2019 | $3,505 | $51,550 | $10,310 | $41,240 |
| 2018 | $3,392 | $46,130 | $9,220 | $36,910 |
| 2017 | $3,261 | $43,520 | $8,700 | $34,820 |
| 2016 | $3,359 | $42,210 | $8,440 | $33,770 |
| 2015 | $3,022 | $42,210 | $8,440 | $33,770 |
Source: Public Records
Map
Nearby Homes
- 1911 E Bruce Ave
- 1822 E Lexington Ave
- 1831 E Linda Ln
- 127 N Date Palm Dr
- 2187 E Finley St
- 2538 E Page Ct
- 1688 E Heather Ave
- 2047 E Victor Rd
- 1754 E Cotton Ct
- 1699 E Olive Ave
- 1639 E Redfield Rd
- 2069 E Sierra Madre Ave
- 1612 E Laurel Ave
- 525 N Redrock St
- 1538 E Laurel Ave
- 1638 E Barbarita Ave
- 2042 E Dias Dr
- 1510 E Campbell Ave
- 1464 E Lexington Ave
- 1745 E Cheyenne St
- 2116 E Vaughn Ave
- 2092 E Vaughn Ave Unit 47
- 2101 E Vaughn Ave
- 2074 E Vaughn Ave
- 2087 E Vaughn Ave
- 2130 E Vaughn Ave
- 2115 E Vaughn Ave
- 2071 E Vaughn Ave
- 2064 E Vaughn Ave Unit 45
- 15715 E Chapala St
- 2129 E Vaughn Ave
- 15637 E Chapala St
- 15701 E Chapala St
- 2053 E Vaughn Ave
- 2144 E Vaughn Ave
- 2044 E Vaughn Ave
- 15729 E Chapala St
- 2102 E Page Ave
- 15623 E Chapala St
- 2143 E Vaughn Ave
Your Personal Tour Guide
Ask me questions while you tour the home.