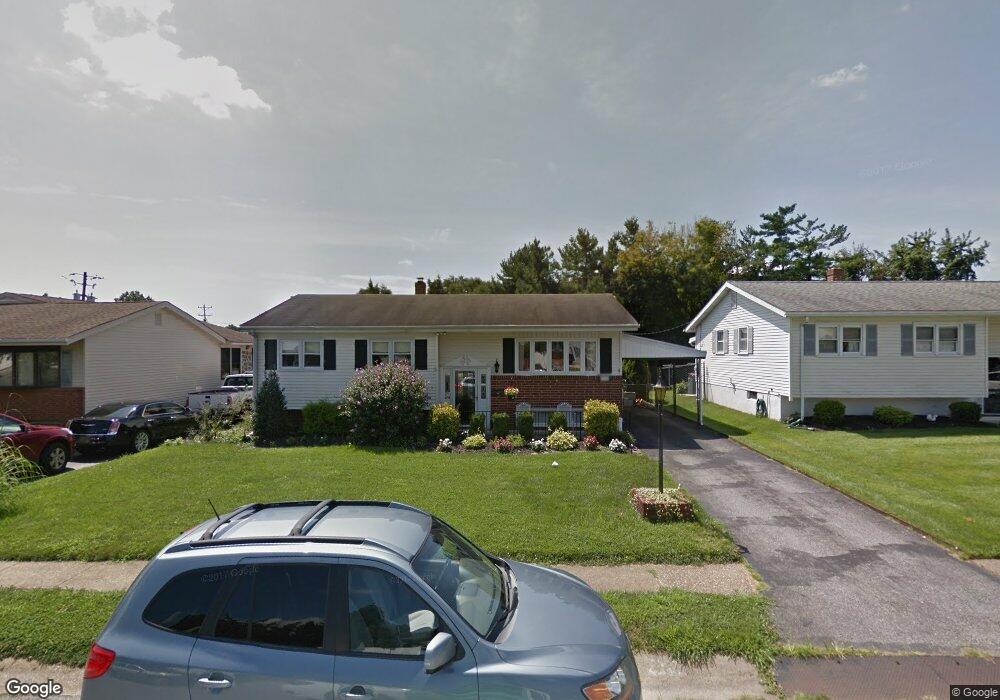
2103 Elder Dr Wilmington, DE 19808
Westminster NeighborhoodEstimated Value: $320,000 - $389,000
3
Beds
2
Baths
1,675
Sq Ft
$209/Sq Ft
Est. Value
About This Home
This home is located at 2103 Elder Dr, Wilmington, DE 19808 and is currently estimated at $350,687, approximately $209 per square foot. 2103 Elder Dr is a home located in New Castle County with nearby schools including Marbrook Elementary School, Alexis I. du Pont Middle School, and Thomas McKean High School.
Ownership History
Date
Name
Owned For
Owner Type
Purchase Details
Closed on
May 10, 2017
Sold by
Snyder Sharon L and Quillen Sharon L
Bought by
Quillen Sharon L
Current Estimated Value
Purchase Details
Closed on
Jun 25, 2009
Sold by
Marasoglou Christos
Bought by
Snyder Sharon L
Home Financials for this Owner
Home Financials are based on the most recent Mortgage that was taken out on this home.
Original Mortgage
$208,587
Outstanding Balance
$132,990
Interest Rate
4.86%
Mortgage Type
FHA
Estimated Equity
$217,697
Create a Home Valuation Report for This Property
The Home Valuation Report is an in-depth analysis detailing your home's value as well as a comparison with similar homes in the area
Home Values in the Area
Average Home Value in this Area
Purchase History
| Date | Buyer | Sale Price | Title Company |
|---|---|---|---|
| Quillen Sharon L | -- | None Available | |
| Snyder Sharon L | $215,000 | None Available |
Source: Public Records
Mortgage History
| Date | Status | Borrower | Loan Amount |
|---|---|---|---|
| Open | Snyder Sharon L | $208,587 |
Source: Public Records
Tax History Compared to Growth
Tax History
| Year | Tax Paid | Tax Assessment Tax Assessment Total Assessment is a certain percentage of the fair market value that is determined by local assessors to be the total taxable value of land and additions on the property. | Land | Improvement |
|---|---|---|---|---|
| 2024 | $1,825 | $49,400 | $11,100 | $38,300 |
| 2023 | $1,610 | $49,400 | $11,100 | $38,300 |
| 2022 | $1,629 | $49,400 | $11,100 | $38,300 |
| 2021 | $1,629 | $49,400 | $11,100 | $38,300 |
| 2020 | $1,635 | $49,400 | $11,100 | $38,300 |
| 2019 | $1,851 | $49,400 | $11,100 | $38,300 |
| 2018 | $1,600 | $49,400 | $11,100 | $38,300 |
| 2017 | $1,580 | $49,400 | $11,100 | $38,300 |
| 2016 | $1,509 | $49,400 | $11,100 | $38,300 |
| 2015 | $1,414 | $49,400 | $11,100 | $38,300 |
| 2014 | $1,308 | $49,400 | $11,100 | $38,300 |
Source: Public Records
Map
Nearby Homes
- 7 Albertson Blvd
- 2146 Elder Dr
- 10 Elliott Ave
- 37 N Woodward Ave
- 5 Hawthorne Ave
- 1111 Wagoner Dr
- 3419 LOT 4 Old Capitol Trail
- 3419 LOT 3 Old Capitol Trail
- 3419 LOT 2 Old Capitol Trail
- 2004 Faulkland Rd
- 3423 Clayton Ave
- 2500 Linkwood Ave
- 0 Exmore Ave
- 102 Central Ave
- 1405 Brook Ln
- 0 Central Ave
- 101 Brighton Ave
- 2507 Newport Gap Pike
- 2521 Turnstone Dr
- 116 Brookside Ave