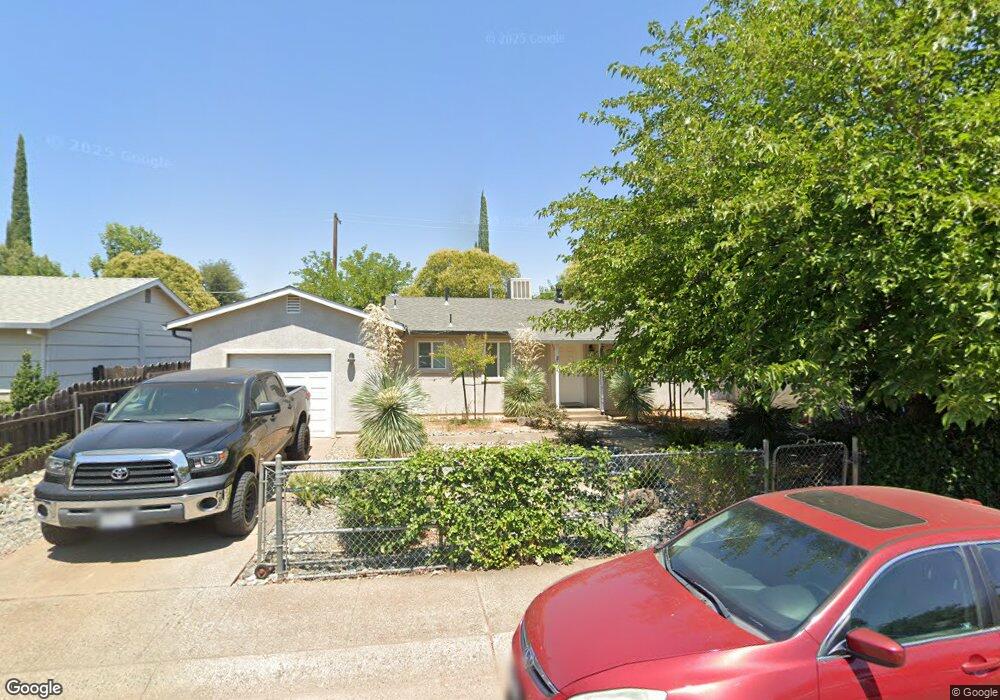
2104 Comet St Unit 1 Redding, CA 96002
Starview NeighborhoodEstimated Value: $258,000 - $297,000
3
Beds
1
Bath
910
Sq Ft
$303/Sq Ft
Est. Value
About This Home
This home is located at 2104 Comet St Unit 1, Redding, CA 96002 and is currently estimated at $276,115, approximately $303 per square foot. 2104 Comet St Unit 1 is a home located in Shasta County with nearby schools including Alta Mesa Elementary School, Parsons Junior High School, and Enterprise High School.
Ownership History
Date
Name
Owned For
Owner Type
Purchase Details
Closed on
Feb 3, 2025
Sold by
H & J Holdings Company
Bought by
H & J Holding Company
Current Estimated Value
Home Financials for this Owner
Home Financials are based on the most recent Mortgage that was taken out on this home.
Original Mortgage
$90,000
Outstanding Balance
$89,459
Interest Rate
6.85%
Mortgage Type
New Conventional
Estimated Equity
$186,656
Purchase Details
Closed on
Feb 21, 2024
Sold by
530 Investments Llc
Bought by
H & J Holdings Company Llc
Purchase Details
Closed on
Aug 15, 2018
Sold by
Bishop Robert E
Bought by
530 Investments Llc
Purchase Details
Closed on
Jul 20, 1998
Sold by
Moglia Joseph D and Moglia Judy A
Bought by
Bishop Mona S and Bishop Robert E
Create a Home Valuation Report for This Property
The Home Valuation Report is an in-depth analysis detailing your home's value as well as a comparison with similar homes in the area
Home Values in the Area
Average Home Value in this Area
Purchase History
| Date | Buyer | Sale Price | Title Company |
|---|---|---|---|
| H & J Holding Company | -- | First American Title | |
| H & J Holdings Company Llc | -- | None Listed On Document | |
| H & J Holdings Company Llc | -- | None Listed On Document | |
| 530 Investments Llc | $75,000 | Fidelity National Title Co O | |
| Bishop Robert E | -- | Fidelity National Title Co O | |
| Bishop Mona S | $65,000 | Redding Title Company |
Source: Public Records
Mortgage History
| Date | Status | Borrower | Loan Amount |
|---|---|---|---|
| Open | H & J Holding Company | $90,000 |
Source: Public Records
Tax History
| Year | Tax Paid | Tax Assessment Tax Assessment Total Assessment is a certain percentage of the fair market value that is determined by local assessors to be the total taxable value of land and additions on the property. | Land | Improvement |
|---|---|---|---|---|
| 2025 | $1,642 | $285,000 | $50,000 | $235,000 |
| 2024 | $1,619 | $146,350 | $43,743 | $102,607 |
| 2023 | $1,619 | $143,482 | $42,886 | $100,596 |
| 2022 | $1,573 | $140,670 | $42,046 | $98,624 |
| 2021 | $1,520 | $137,913 | $41,222 | $96,691 |
| 2020 | $1,513 | $136,500 | $40,800 | $95,700 |
| 2019 | $857 | $75,000 | $40,000 | $35,000 |
| 2018 | $945 | $89,472 | $27,548 | $61,924 |
| 2017 | $960 | $87,718 | $27,008 | $60,710 |
| 2016 | $897 | $85,999 | $26,479 | $59,520 |
| 2015 | $888 | $84,708 | $26,082 | $58,626 |
| 2014 | $881 | $83,050 | $25,572 | $57,478 |
Source: Public Records
Map
Nearby Homes
- 3732 Mercury Dr
- 2068 Solar Way
- 2332 Venus Way
- 3778 Scorpius Way
- 3985 Cirrus St
- 3528 Silverwood St
- 4001 Alta Mesa Dr
- 3466 Silverwood St
- 3594 Laramie St
- 3425 Silverwood St
- 3688 Polaris Way
- 3341 Timbercreek Dr
- 3512 Capricorn Way
- 3072 Alta Mesa Dr
- 1513 Harpole Rd
- 0 Shasta View Unit 25-1945
- 3293 Middleton Ln
- 1397 Empress Ln
- 1959 Alexis Ct
- 3283 Middleton Ln
Your Personal Tour Guide
Ask me questions while you tour the home.