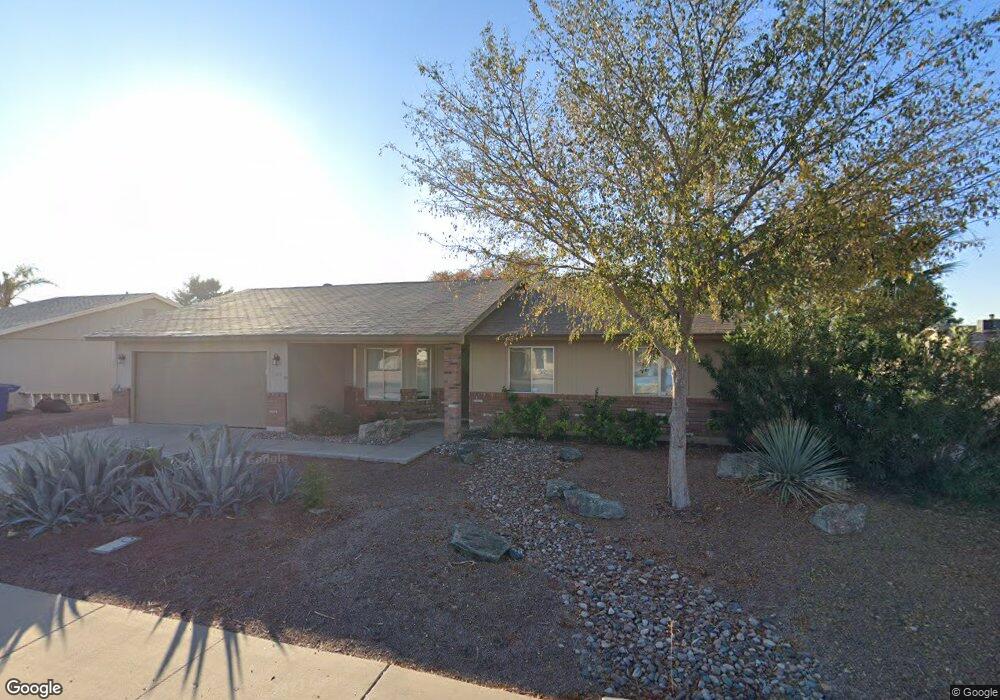
2105 E Cindy St Chandler, AZ 85225
East Chandler NeighborhoodEstimated Value: $416,213 - $475,000
Studio
2
Baths
1,566
Sq Ft
$289/Sq Ft
Est. Value
About This Home
This home is located at 2105 E Cindy St, Chandler, AZ 85225 and is currently estimated at $452,303, approximately $288 per square foot. 2105 E Cindy St is a home located in Maricopa County with nearby schools including Chandler Traditional Academy-Humphrey, Willis Junior High School, and BASIS Chandler Primary North Campus.
Ownership History
Date
Name
Owned For
Owner Type
Purchase Details
Closed on
Jan 6, 2020
Sold by
Brittner Lonny Bruce
Bought by
Brittner Lonny
Current Estimated Value
Home Financials for this Owner
Home Financials are based on the most recent Mortgage that was taken out on this home.
Original Mortgage
$187,200
Outstanding Balance
$163,973
Interest Rate
3.6%
Mortgage Type
New Conventional
Estimated Equity
$288,330
Purchase Details
Closed on
Feb 12, 2019
Sold by
Schneider Brian
Bought by
Brittner Lonny Bruce
Home Financials for this Owner
Home Financials are based on the most recent Mortgage that was taken out on this home.
Original Mortgage
$127,294
Interest Rate
4.4%
Mortgage Type
New Conventional
Purchase Details
Closed on
Nov 30, 2011
Sold by
King Howard E and King Robin L
Bought by
Schneider Brian
Create a Home Valuation Report for This Property
The Home Valuation Report is an in-depth analysis detailing your home's value as well as a comparison with similar homes in the area
Home Values in the Area
Average Home Value in this Area
Purchase History
| Date | Buyer | Sale Price | Title Company |
|---|---|---|---|
| Brittner Lonny | -- | Pioneer Title Agency Inc | |
| Brittner Lonny Bruce | $159,117 | Grand Canyon Title Agency | |
| Schneider Brian | -- | Grand Canyon Title Agency | |
| Schneider Brian | $101,500 | None Available |
Source: Public Records
Mortgage History
| Date | Status | Borrower | Loan Amount |
|---|---|---|---|
| Open | Brittner Lonny | $187,200 | |
| Closed | Brittner Lonny Bruce | $127,294 |
Source: Public Records
Tax History
| Year | Tax Paid | Tax Assessment Tax Assessment Total Assessment is a certain percentage of the fair market value that is determined by local assessors to be the total taxable value of land and additions on the property. | Land | Improvement |
|---|---|---|---|---|
| 2025 | $1,373 | $17,629 | -- | -- |
| 2024 | $1,326 | $16,789 | -- | -- |
| 2023 | $1,326 | $33,950 | $6,790 | $27,160 |
| 2022 | $1,280 | $25,670 | $5,130 | $20,540 |
| 2021 | $1,341 | $24,660 | $4,930 | $19,730 |
| 2020 | $1,335 | $22,400 | $4,480 | $17,920 |
| 2019 | $1,284 | $20,100 | $4,020 | $16,080 |
| 2018 | $1,476 | $18,050 | $3,610 | $14,440 |
| 2017 | $1,387 | $16,280 | $3,250 | $13,030 |
| 2016 | $1,340 | $15,330 | $3,060 | $12,270 |
| 2015 | $1,285 | $14,460 | $2,890 | $11,570 |
Source: Public Records
Map
Nearby Homes
- 2109 E Cindy St
- 2230 E Frye Rd
- 2019 E Butler St
- 2014 E Butler St
- 2010 E Butler St
- 333 S Cooper Rd
- 95 N Cooper Rd Unit 75
- 25 N Cottonwood St Unit 47
- 111 N Soho Place
- 2 S 130th Place
- 195 N Cottonwood St Unit 21
- 1871 E Buffalo St
- 83 N Amber Ct
- 1731 E Folley Ct
- 1750 E Camino Ct
- 24 S Willow Creek St
- 2120 E Geronimo St
- 1670 E Whitten St
- 927 S Soho Ln
- 1954 E Geronimo St
- 2102 E Frye Rd
- 2023 E Cindy St
- 2106 E Frye Rd
- 2113 E Cindy St
- 2106 E Cindy St Unit 3
- 2110 E Cindy St
- 2026 E Frye Rd
- 2110 E Frye Rd
- 2024 E Cindy St
- 2019 E Cindy St
- 2114 E Cindy St
- 2117 E Cindy St
- 2022 E Frye Rd
- 2114 E Frye Rd
- 2020 E Cindy St
- 2101 E Chicago St
- 2103 E Frye Rd Unit 3
- 2015 E Cindy St
- 2105 E Chicago St
- 2118 E Cindy St
Your Personal Tour Guide
Ask me questions while you tour the home.