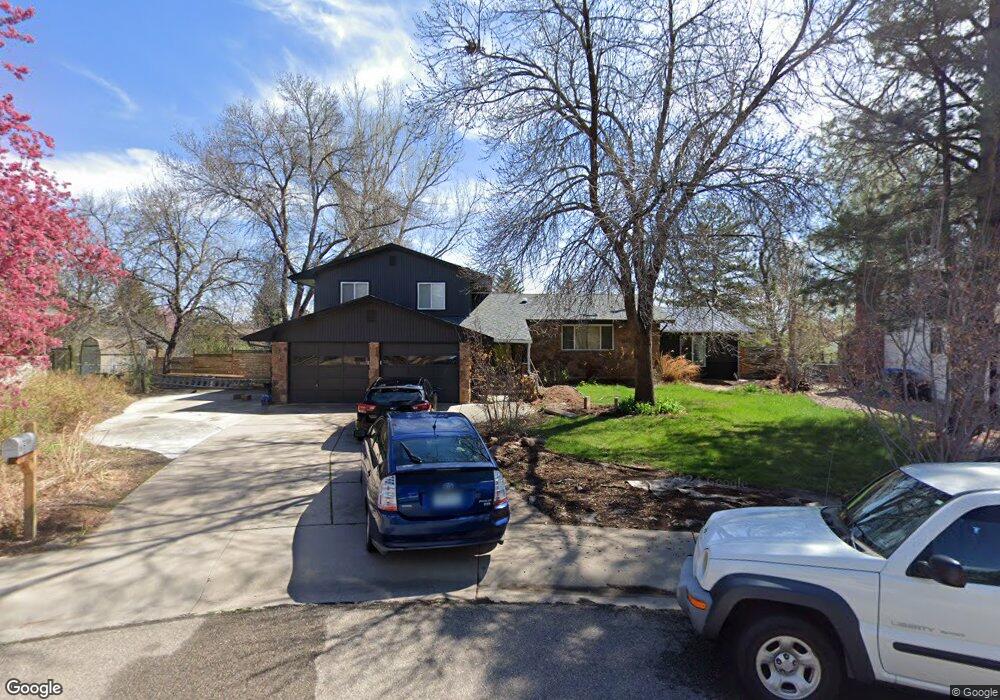
2106 Essex Ct Fort Collins, CO 80526
Estimated Value: $535,080 - $734,000
4
Beds
3
Baths
1,764
Sq Ft
$350/Sq Ft
Est. Value
About This Home
This home is located at 2106 Essex Ct, Fort Collins, CO 80526 and is currently estimated at $616,520, approximately $349 per square foot. 2106 Essex Ct is a home located in Larimer County with nearby schools including Bennett Elementary School, Blevins Middle School, and Rocky Mountain High School.
Ownership History
Date
Name
Owned For
Owner Type
Purchase Details
Closed on
Apr 14, 2025
Sold by
Stalnaker Clair
Bought by
Stalnaker J Grant J and Stalnaker Mary L
Current Estimated Value
Purchase Details
Closed on
Oct 8, 2010
Sold by
Stalnaker Mary L and Grant Stalnaker J
Bought by
Stalnaker Clair
Purchase Details
Closed on
Jun 2, 2005
Sold by
Bundy Jay M and Bundy Lora A
Bought by
Stalnaker J Grant and Stalnaker Mary L
Home Financials for this Owner
Home Financials are based on the most recent Mortgage that was taken out on this home.
Original Mortgage
$188,800
Interest Rate
4%
Mortgage Type
New Conventional
Purchase Details
Closed on
Feb 28, 2000
Sold by
Siegfried Larry R and Siegfried Linda J
Bought by
Bundy Jay M and Bundy Lora A
Home Financials for this Owner
Home Financials are based on the most recent Mortgage that was taken out on this home.
Original Mortgage
$137,200
Interest Rate
8.31%
Purchase Details
Closed on
Oct 1, 1979
Bought by
Siegfried Larry R
Create a Home Valuation Report for This Property
The Home Valuation Report is an in-depth analysis detailing your home's value as well as a comparison with similar homes in the area
Home Values in the Area
Average Home Value in this Area
Purchase History
| Date | Buyer | Sale Price | Title Company |
|---|---|---|---|
| Stalnaker J Grant J | -- | None Listed On Document | |
| Stalnaker Clair | -- | None Available | |
| Stalnaker J Grant | $236,000 | Security Title | |
| Bundy Jay M | $171,500 | Land Title | |
| Siegfried Larry R | $78,500 | -- |
Source: Public Records
Mortgage History
| Date | Status | Borrower | Loan Amount |
|---|---|---|---|
| Previous Owner | Stalnaker J Grant | $188,800 | |
| Previous Owner | Bundy Jay M | $137,200 |
Source: Public Records
Tax History Compared to Growth
Tax History
| Year | Tax Paid | Tax Assessment Tax Assessment Total Assessment is a certain percentage of the fair market value that is determined by local assessors to be the total taxable value of land and additions on the property. | Land | Improvement |
|---|---|---|---|---|
| 2025 | $3,698 | $42,230 | $3,015 | $39,215 |
| 2024 | $3,519 | $42,230 | $3,015 | $39,215 |
| 2022 | $2,846 | $30,136 | $3,128 | $27,008 |
| 2021 | $2,876 | $31,003 | $3,218 | $27,785 |
| 2020 | $2,828 | $30,224 | $3,218 | $27,006 |
| 2019 | $2,840 | $30,224 | $3,218 | $27,006 |
| 2018 | $2,420 | $26,554 | $3,240 | $23,314 |
| 2017 | $2,412 | $26,554 | $3,240 | $23,314 |
| 2016 | $2,070 | $22,678 | $3,582 | $19,096 |
| 2015 | $2,055 | $22,680 | $3,580 | $19,100 |
| 2014 | $1,793 | $19,660 | $3,580 | $16,080 |
Source: Public Records
Map
Nearby Homes
- 1701 Glenwood Dr
- 1513 Independence Rd
- 1854 Marlborough Ct
- 2404 Sheffield Cir E
- 1955 Kingsborough Dr
- 2420 Sheffield Cir E
- 1757 Concord Dr
- 2206 Rambouillet Dr
- 1333 Village Park Ct
- 1680 Foxbrook Way
- 2109 W Drake Rd
- 1705 Heatheridge Rd Unit A104
- 1705 Heatheridge Rd Unit K105
- 1705 Heatheridge Rd Unit L201
- 1705 Heatheridge Rd Unit E101
- 1705 Heatheridge Rd Unit M204
- 1705 Heatheridge Rd Unit G302
- 1905 Yorktown Ave
- 1300 W Stuart St Unit 23
- 2613 Hanover Dr
- 2100 Essex Ct
- 2112 Essex Ct
- 2107 Constitution Ave
- 2101 Constitution Ave
- 2113 Constitution Ave
- 1713 Glenwood Dr
- 1719 Glenwood Dr
- 1707 Glenwood Dr
- 2118 Essex Ct
- 2119 Constitution Ave
- 1725 Glenwood Dr
- 2101 Essex Ct
- 2107 Essex Ct
- 2119 Essex Ct
- 1731 Glenwood Dr
- 2125 Constitution Ave
- 2124 Essex Ct
- 2125 Essex Ct
- 1712 Glenwood Dr
- 1737 Glenwood Dr