
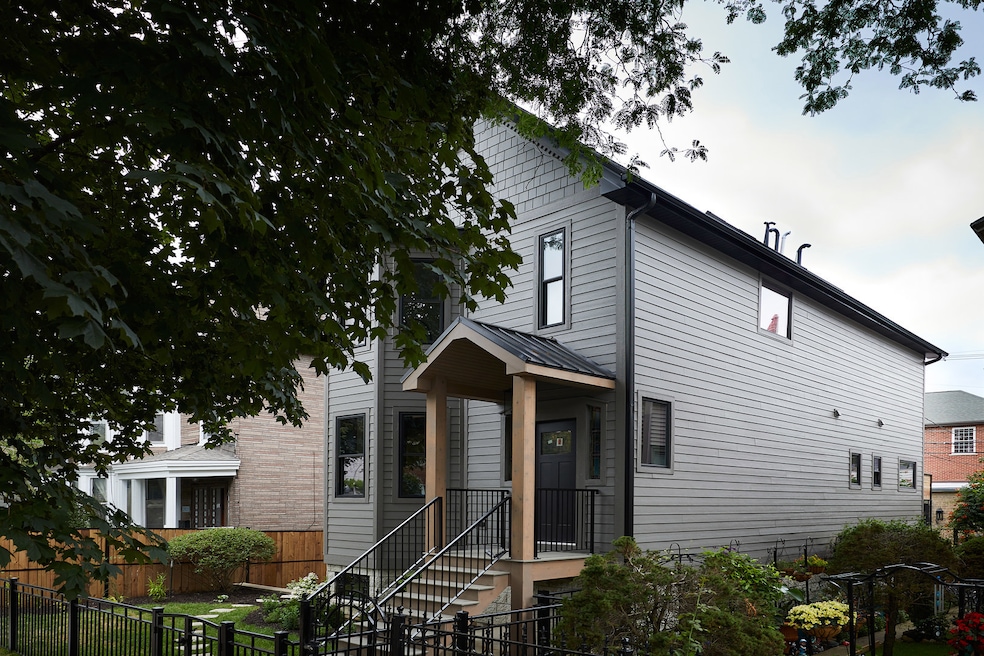
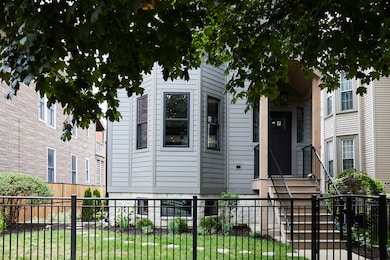
2106 N Campbell Ave Chicago, IL 60647
Logan Square NeighborhoodEstimated payment $9,340/month
Total Views
2,766
3
Beds
3.5
Baths
3,000
Sq Ft
$545
Price per Sq Ft
Highlights
- Deck
- Laundry Room
- Dining Room
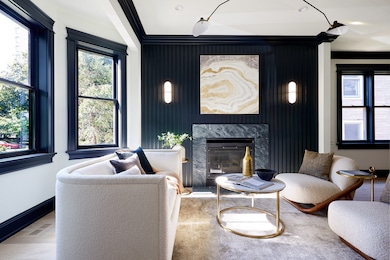
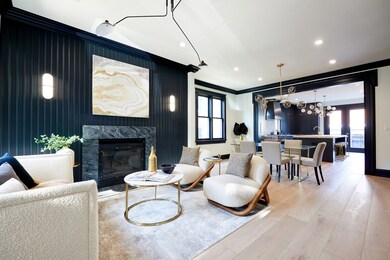
- Living Room with Fireplace
- Forced Air Heating and Cooling System
- Family Room
About This Home
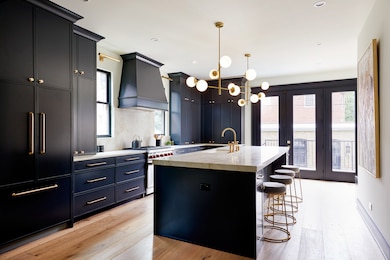
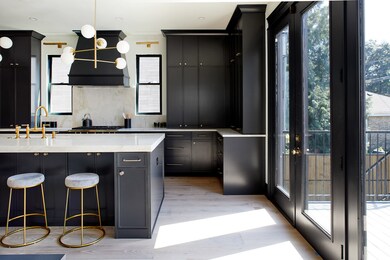
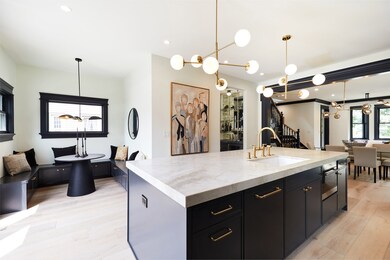
Stunning and sophisticated on a massive, oversized and extra wide lot in a prime Logan Square/Bucktown setting, this fully redesigned and renovated light-flooded single family home has it all....including ULTRA low property taxes. Soak up peaceful home living in this tranquil garden setting in this 4 bed, 3.5 bath home with open living space, landscape-designed exterior, a primary suite wing with a large walk-in closet on second floor, two additional bedrooms and a full bath on second floor, large kitchen with incredible details with oversized thickened quartzite island with massive, high-design cabinetry, high-end Fischer Paykal French door fridge, Wolf range with custom hood, wide plank gorgeous flooring, two fireplaces, an ultra-cool kitchen bar with smoked antique glass and French bistro shelving, a highly useful breakfast nook, a well-designed fully built-out second floor laundry room with cabinetry (and a laundry hookup in basement for secondary laundry), massive 3 car brick garage, large composite and steel deck off the kitchen for outdoor fun, guest bedroom and full bath in the basement, large, open family room in the basement with fireplace and custom wetbar, dual zoned HVAC, tankless water heater, radiant heated basement floors, and much more. Incredible paneling and updated vintage style molding throughout. Agent owned interest. Come live in a perfect setting to enjoy all that 2106 N. Campbell has to offer.
Home Details
Home Type
- Single Family
Est. Annual Taxes
- $3,718
Year Renovated
- 2025
Parking
- 3 Car Garage
- Parking Included in Price
Interior Spaces
- 3,000 Sq Ft Home
- 2-Story Property
- Family Room
- Living Room with Fireplace
- 2 Fireplaces
- Dining Room
- Laundry Room
Bedrooms and Bathrooms
- 3 Bedrooms
- 4 Potential Bedrooms
Basement
- Basement Fills Entire Space Under The House
- Fireplace in Basement
- Finished Basement Bathroom
Utilities
- Forced Air Heating and Cooling System
- Heating System Uses Natural Gas
- Radiant Heating System
Additional Features
- Deck
- Lot Dimensions are 35x110
Map
Create a Home Valuation Report for This Property
The Home Valuation Report is an in-depth analysis detailing your home's value as well as a comparison with similar homes in the area
Home Values in the Area
Average Home Value in this Area
Tax History
| Year | Tax Paid | Tax Assessment Tax Assessment Total Assessment is a certain percentage of the fair market value that is determined by local assessors to be the total taxable value of land and additions on the property. | Land | Improvement |
|---|---|---|---|---|
| 2024 | $3,718 | $21,890 | $21,560 | $330 |
| 2023 | $3,624 | $17,561 | $17,325 | $236 |
| 2022 | $3,624 | $17,561 | $17,325 | $236 |
| 2021 | $4,926 | $24,417 | $17,325 | $7,092 |
| 2020 | $2,248 | $10,053 | $9,817 | $236 |
| 2019 | $2,027 | $10,053 | $9,817 | $236 |
| 2018 | $1,986 | $10,053 | $9,817 | $236 |
| 2017 | $1,915 | $8,898 | $8,662 | $236 |
| 2016 | $1,782 | $8,898 | $8,662 | $236 |
| 2015 | $1,631 | $8,898 | $8,662 | $236 |
| 2014 | $1,490 | $8,032 | $7,796 | $236 |
| 2013 | $1,461 | $8,032 | $7,796 | $236 |
Source: Public Records
Property History
| Date | Event | Price | Change | Sq Ft Price |
|---|---|---|---|---|
| 07/07/2025 07/07/25 | For Sale | $1,635,000 | -- | $545 / Sq Ft |
Source: Midwest Real Estate Data (MRED)
Purchase History
| Date | Type | Sale Price | Title Company |
|---|---|---|---|
| Executors Deed | $585,000 | Citywide Title | |
| Warranty Deed | $110,666 | Ticor Title Insurance |
Source: Public Records
Mortgage History
| Date | Status | Loan Amount | Loan Type |
|---|---|---|---|
| Open | $936,000 | Credit Line Revolving | |
| Previous Owner | $243,000 | New Conventional | |
| Previous Owner | $286,000 | Credit Line Revolving | |
| Previous Owner | $75,000 | Stand Alone Second | |
| Previous Owner | $257,000 | Unknown | |
| Previous Owner | $252,700 | Unknown | |
| Previous Owner | $252,700 | Unknown | |
| Previous Owner | $149,000 | No Value Available |
Source: Public Records
Similar Homes in the area
Source: Midwest Real Estate Data (MRED)
MLS Number: 12412307
APN: 13-36-223-035-0000
Disclaimer: Certain information contained herein is derived from information provided by parties other than Homes.com. All information provided is deemed reliable, but is not guaranteed to be accurate and should be independently verified.
![]() Based on information submitted to the MLS GRID. All data is obtained from various sources and may not have been verified by broker or MLS GRID. Supplied Open House Information is subject to change without notice. All information should be independently reviewed and verified for accuracy. Properties may or may not be listed by the office/agent presenting the information. Some IDX listings have been excluded from this website.
Based on information submitted to the MLS GRID. All data is obtained from various sources and may not have been verified by broker or MLS GRID. Supplied Open House Information is subject to change without notice. All information should be independently reviewed and verified for accuracy. Properties may or may not be listed by the office/agent presenting the information. Some IDX listings have been excluded from this website.
The Digital Millennium Copyright Act of 1998, 17 U.S.C. § 512 (the “DMCA”) provides recourse for copyright owners who believe that material appearing on the Internet infringes their rights under U.S. copyright law. If you believe in good faith that any content or material made available in connection with our website or services infringes your copyright, you (or your agent) may send us a notice requesting that the content or material be removed, or access to it blocked.
Notices must be sent in writing by email to DMCAnotice@MLSGrid.com.
The DMCA requires that your notice of alleged copyright infringement include the following information:
(1) description of the copyrighted work that is the subject of claimed infringement;
(2) description of the alleged infringing content and information sufficient to permit us to locate the content;
(3) contact information for you, including your address, telephone number and email address;
(4) a statement by you that you have a good faith belief that the content in the manner complained of is not authorized by the copyright owner, or its agent, or by the operation of any law;
(5) a statement by you, signed under penalty of perjury, that the information in the notification is accurate and that you have the authority to enforce the copyrights that are claimed to be infringed; and
(6) a physical or electronic signature of the copyright owner or a person authorized to act on the copyright owner’s behalf. Failure to include all of the above information may result in the delay of the processing of your complaint.
Nearby Homes
- 2076 N Campbell Ave
- 2426 W Mclean Ave
- 2133 N Campbell Ave Unit 2A
- 2147 N Bingham St
- 2014 N Western Ave
- 2212 N Campbell Ave Unit 1D
- 2531 W Lyndale St
- 2319 W Shakespeare Ave
- 2422 W Lyndale St Unit 1E
- 1931 N Campbell Ave Unit 2S
- 2330 W Armitage Ave Unit B
- 2168 N Rockwell St
- 2429 W Belden Ave
- 2535 W Belden Ave
- 2215 N Talman Ave
- 2416 W Belden Ave
- 2011 N Oakley Ave
- 2233 W Shakespeare Ave Unit 1F
- 2451 W Cortland St Unit 3
- 2515 W Cortland St
- 2524 W Palmer St Unit 1R
- 2350 W Charleston St Unit 2R
- 2420 W Palmer St Unit 1st floor
- 2344 W Charleston St Unit 1R
- 2341 W Charleston St Unit 2R
- 2346 W Dickens Ave
- 2053 N Bingham St Unit 1
- 2350 W Charleston St Unit 1R
- 2039 N Western Ave Unit 3
- 2019 N Bingham St Unit ID1244901P
- 2113 N Bingham St Unit 1
- 2000 N Milwaukee Ave Unit 404
- 2000 N Milwaukee Ave Unit 303
- 2021 N Western Ave Unit 2
- 1999 N Milwaukee Ave
- 2171 N Milwaukee Ave Unit 2
- 2242 N Western Ave Unit 1R
- 2242 N Western Ave Unit 2F
- 2312 W Dickens Ave Unit 3R
- 1950 N Campbell Ave