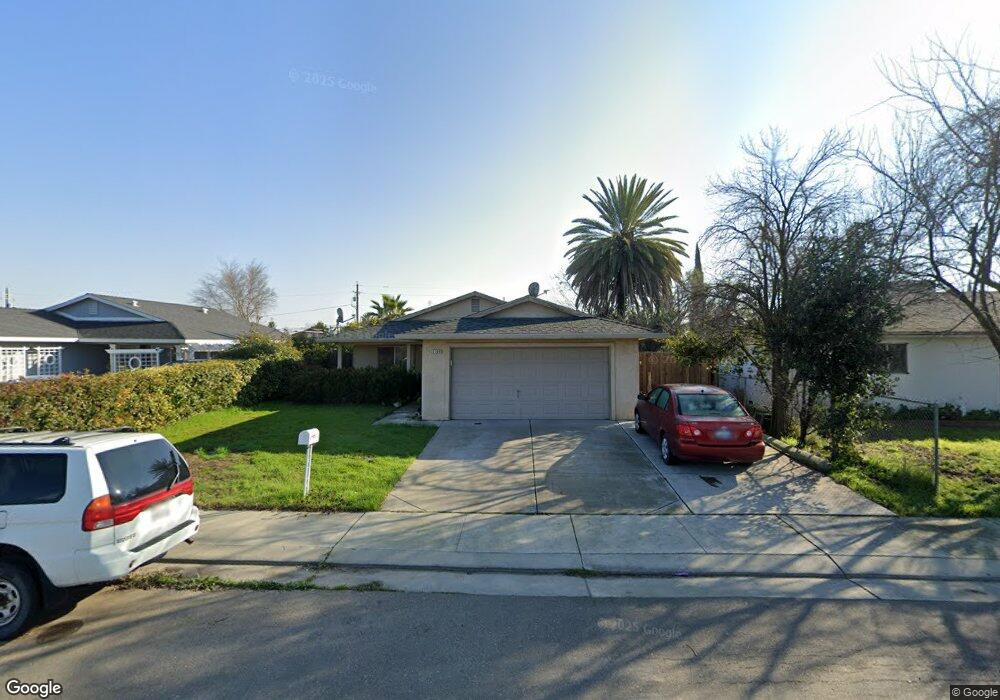
2108 S Yosemite St Stockton, CA 95206
Seaport NeighborhoodEstimated Value: $365,000 - $402,000
4
Beds
2
Baths
1,312
Sq Ft
$294/Sq Ft
Est. Value
About This Home
This home is located at 2108 S Yosemite St, Stockton, CA 95206 and is currently estimated at $386,245, approximately $294 per square foot. 2108 S Yosemite St is a home located in San Joaquin County with nearby schools including John Marshall Elementary School, Taylor Leadership Academy, and San Joaquin Elementary School.
Ownership History
Date
Name
Owned For
Owner Type
Purchase Details
Closed on
Feb 16, 2010
Sold by
Aranda Kenneth A and Aranda Nelsie A
Bought by
Nucal Angelina V and Nucal Dominador
Current Estimated Value
Home Financials for this Owner
Home Financials are based on the most recent Mortgage that was taken out on this home.
Original Mortgage
$95,220
Outstanding Balance
$62,988
Interest Rate
5.02%
Mortgage Type
New Conventional
Estimated Equity
$323,257
Purchase Details
Closed on
Mar 16, 2005
Sold by
Vanzetti Properties and King Peter R
Bought by
Aranda Kenneth A and Aranda Nelsie A
Home Financials for this Owner
Home Financials are based on the most recent Mortgage that was taken out on this home.
Original Mortgage
$213,600
Interest Rate
6.32%
Mortgage Type
Purchase Money Mortgage
Purchase Details
Closed on
Sep 8, 2004
Sold by
King John E
Bought by
King John E and The King Family Trust
Create a Home Valuation Report for This Property
The Home Valuation Report is an in-depth analysis detailing your home's value as well as a comparison with similar homes in the area
Home Values in the Area
Average Home Value in this Area
Purchase History
| Date | Buyer | Sale Price | Title Company |
|---|---|---|---|
| Nucal Angelina V | $106,000 | Fidelity National Title Co | |
| Aranda Kenneth A | $267,000 | Fidelity Natl Title Ins Co | |
| Vanzetti Properties Lp | -- | Fidelity Natl Title Ins Co | |
| King John E | -- | -- |
Source: Public Records
Mortgage History
| Date | Status | Borrower | Loan Amount |
|---|---|---|---|
| Open | Nucal Angelina V | $95,220 | |
| Previous Owner | Aranda Kenneth A | $213,600 | |
| Closed | Aranda Kenneth A | $53,400 |
Source: Public Records
Tax History Compared to Growth
Tax History
| Year | Tax Paid | Tax Assessment Tax Assessment Total Assessment is a certain percentage of the fair market value that is determined by local assessors to be the total taxable value of land and additions on the property. | Land | Improvement |
|---|---|---|---|---|
| 2025 | $1,722 | $136,557 | $33,556 | $103,001 |
| 2024 | $1,692 | $133,881 | $32,899 | $100,982 |
| 2023 | $1,652 | $131,256 | $32,254 | $99,002 |
| 2022 | $1,533 | $128,683 | $31,622 | $97,061 |
| 2021 | $1,472 | $126,160 | $31,002 | $95,158 |
| 2020 | $1,499 | $124,868 | $30,685 | $94,183 |
| 2019 | $1,492 | $122,421 | $30,084 | $92,337 |
| 2018 | $1,462 | $120,022 | $29,495 | $90,527 |
| 2017 | $1,384 | $117,669 | $28,917 | $88,752 |
| 2016 | $1,407 | $115,362 | $28,350 | $87,012 |
| 2015 | $1,405 | $113,630 | $27,924 | $85,706 |
| 2014 | $1,337 | $111,405 | $27,377 | $84,028 |
Source: Public Records
Map
Nearby Homes
- 2353 Georgia Ave
- 1328 Luna Ln
- 1409 Laguna Cir
- 1425 Silverbell Dr
- 1232 Denver Ave
- 426 Howard St
- 544 W 9th St
- 1932 S Lincoln St
- 407 W 7th St
- 364 W 7th St
- 314 Kolher St
- 2510 S Harrison St
- 2128 Green River Ln
- 220 Delhi Ave
- 2650 S Fresno Ave
- 520 W Jackson St
- 416 W Jackson St
- 645 W Anderson St
- 3228 Fairmont Ave
- 174 Horton Ave
- 2104 S Yosemite St
- 2112 S Yosemite St
- 2050 S Yosemite St
- 2075 S Stockton St
- 2122 S Yosemite St
- 2063 S Stockton St
- 2111 S Stockton St
- 2107 S Yosemite St
- 2055 S Stockton St
- 2103 S Yosemite St
- 2121 S Stockton St
- 2111 S Yosemite St
- 2134 S Yosemite St
- 2051 S Yosemite St
- 2121 S Yosemite St
- 2049 S Stockton St
- 2133 S Stockton St
- 2039 S Yosemite St
- 2133 S Yosemite St