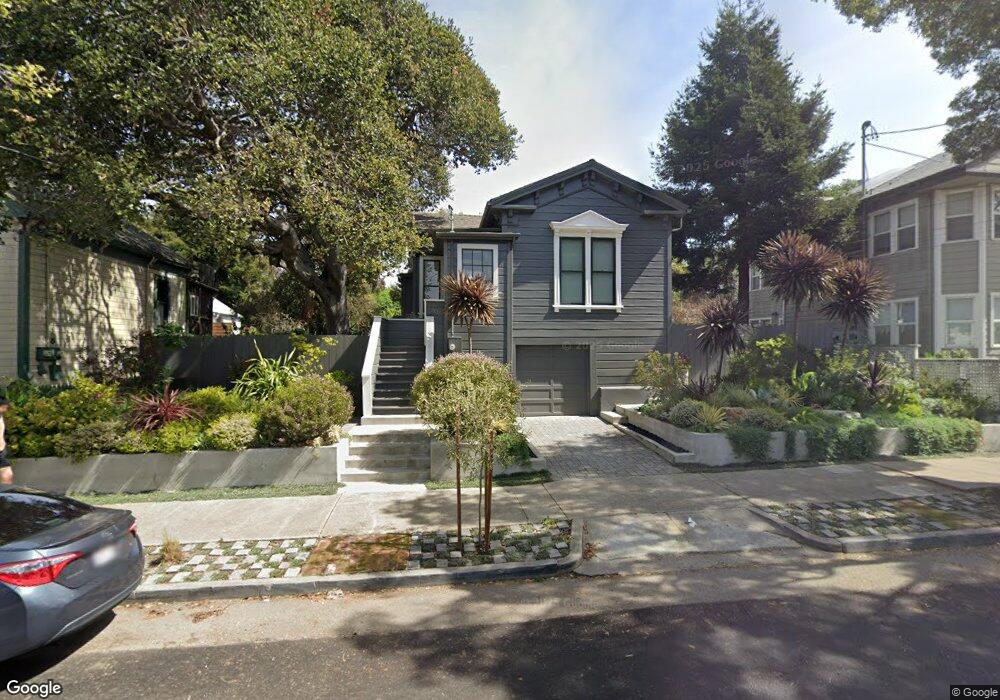
2109 5th St Berkeley, CA 94710
West Berkeley NeighborhoodEstimated Value: $907,000 - $1,170,533
3
Beds
1
Bath
1,161
Sq Ft
$920/Sq Ft
Est. Value
About This Home
This home is located at 2109 5th St, Berkeley, CA 94710 and is currently estimated at $1,068,133, approximately $920 per square foot. 2109 5th St is a home located in Alameda County with nearby schools including Rosa Parks Elementary School, Ruth Acty Elementary, and Berkeley Arts Magnet at Whittier School.
Ownership History
Date
Name
Owned For
Owner Type
Purchase Details
Closed on
Dec 19, 2013
Sold by
Roach Riley D and Roach Vanessa L
Bought by
Gibson Sean and Ingre Serena
Current Estimated Value
Home Financials for this Owner
Home Financials are based on the most recent Mortgage that was taken out on this home.
Original Mortgage
$540,000
Outstanding Balance
$389,865
Interest Rate
3.37%
Mortgage Type
Adjustable Rate Mortgage/ARM
Estimated Equity
$678,268
Purchase Details
Closed on
Oct 21, 1999
Sold by
Brown Patricia L
Bought by
Roach Riley D and White Vanessa L
Home Financials for this Owner
Home Financials are based on the most recent Mortgage that was taken out on this home.
Original Mortgage
$240,000
Interest Rate
7.75%
Purchase Details
Closed on
Aug 24, 1999
Sold by
Brown Phillip R
Bought by
Brown Patricia L
Home Financials for this Owner
Home Financials are based on the most recent Mortgage that was taken out on this home.
Original Mortgage
$240,000
Interest Rate
7.75%
Create a Home Valuation Report for This Property
The Home Valuation Report is an in-depth analysis detailing your home's value as well as a comparison with similar homes in the area
Home Values in the Area
Average Home Value in this Area
Purchase History
| Date | Buyer | Sale Price | Title Company |
|---|---|---|---|
| Gibson Sean | $675,000 | Placer Title Company | |
| Roach Riley D | $400,000 | Chicago Title Co | |
| Brown Patricia L | -- | -- |
Source: Public Records
Mortgage History
| Date | Status | Borrower | Loan Amount |
|---|---|---|---|
| Open | Gibson Sean | $540,000 | |
| Previous Owner | Roach Riley D | $240,000 |
Source: Public Records
Tax History
| Year | Tax Paid | Tax Assessment Tax Assessment Total Assessment is a certain percentage of the fair market value that is determined by local assessors to be the total taxable value of land and additions on the property. | Land | Improvement |
|---|---|---|---|---|
| 2025 | $13,360 | $820,421 | $248,226 | $579,195 |
| 2024 | $13,360 | $804,201 | $243,360 | $567,841 |
| 2023 | $13,071 | $795,297 | $238,589 | $556,708 |
| 2022 | $12,816 | $772,705 | $233,911 | $545,794 |
| 2021 | $12,833 | $757,423 | $229,327 | $535,096 |
| 2020 | $12,097 | $756,587 | $226,976 | $529,611 |
| 2019 | $11,571 | $741,757 | $222,527 | $519,230 |
| 2018 | $11,364 | $727,217 | $218,165 | $509,052 |
| 2017 | $10,964 | $712,961 | $213,888 | $499,073 |
| 2016 | $10,580 | $698,981 | $209,694 | $489,287 |
| 2015 | $10,433 | $688,485 | $206,545 | $481,940 |
| 2014 | $8,225 | $501,507 | $150,452 | $351,055 |
Source: Public Records
Map
Nearby Homes
- 1050 Allston Way
- 2220 7th St
- 2238 7th St
- 2013 9th St
- 931 Bancroft Way
- 1013 Addison St
- 817 Delaware St
- 2241 Ninth St
- 940 Delaware St
- 2327 10th St Unit 4
- 1039 Channing Way
- 2144 Curtis St
- 995 Virginia St
- 1128 Delaware St
- 2512 9th St Unit 10
- 1919 Curtis St
- 1092 Dwight Way
- 2324 Browning St
- 1728 Curtis St
- 1118 Dwight Way
- 2107 5th St
- 814 Addison St
- 2105 5th St
- 2111 5th St
- 2119 5th St
- 2110 6th St
- 2112 6th St
- 2102 6th St
- 2108 6th St Unit 2108
- 2106 6th St Unit 2106
- 2125 5th St Unit 17
- 2120 6th St
- 2120 6th St Unit 14
- 2120 6th St Unit 13
- 2120 6th St Unit 9
- 2120 6th St Unit 8
- 2120 6th St Unit 7
- 2120 6th St Unit 6
- 2120 6th St Unit 5
- 2120 6th St Unit 4
Your Personal Tour Guide
Ask me questions while you tour the home.