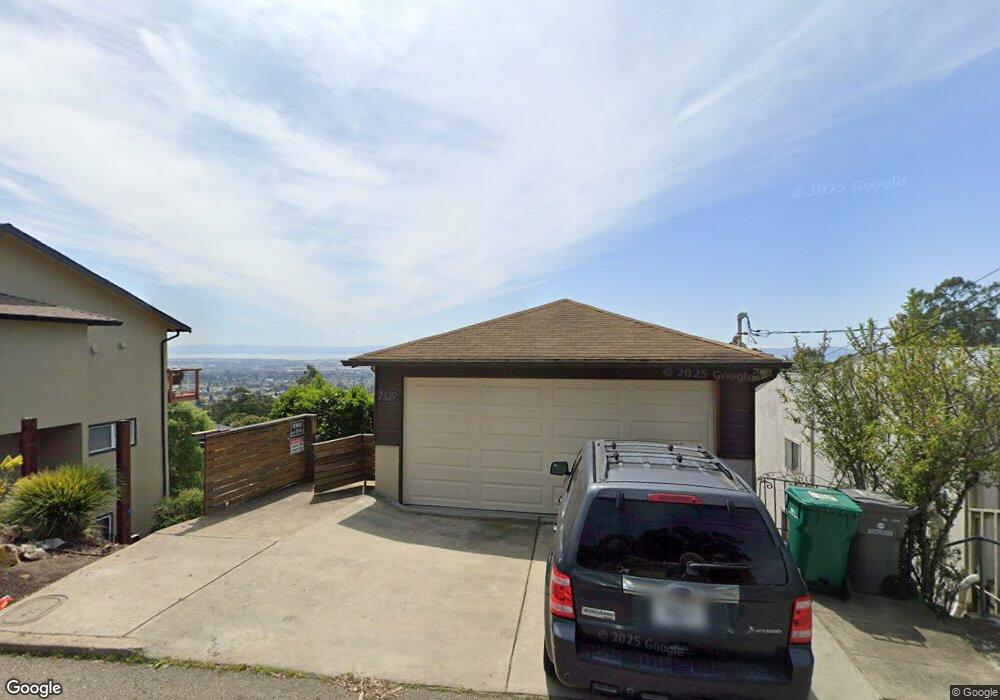
2109 Braemar Rd Oakland, CA 94602
Oakmore NeighborhoodEstimated Value: $1,398,000 - $2,614,000
4
Beds
4
Baths
2,700
Sq Ft
$686/Sq Ft
Est. Value
About This Home
This home is located at 2109 Braemar Rd, Oakland, CA 94602 and is currently estimated at $1,851,447, approximately $685 per square foot. 2109 Braemar Rd is a home located in Alameda County with nearby schools including Joaquin Miller Elementary School, Montera Middle School, and Skyline High School.
Ownership History
Date
Name
Owned For
Owner Type
Purchase Details
Closed on
Jan 2, 2013
Sold by
Hu Jack and Yonker Justin
Bought by
Chen Lin Lin and Chen Van Dyk
Current Estimated Value
Home Financials for this Owner
Home Financials are based on the most recent Mortgage that was taken out on this home.
Original Mortgage
$625,500
Outstanding Balance
$118,496
Interest Rate
3.27%
Mortgage Type
New Conventional
Estimated Equity
$1,732,951
Purchase Details
Closed on
May 14, 2012
Sold by
Yonker Alexandria Mercedes
Bought by
Yonker Justin
Home Financials for this Owner
Home Financials are based on the most recent Mortgage that was taken out on this home.
Original Mortgage
$350,000
Interest Rate
3.85%
Mortgage Type
Purchase Money Mortgage
Purchase Details
Closed on
May 11, 2012
Sold by
Graham Vivian Frances and Ella Alyce Troxel Revocable Tr
Bought by
Hu Jack and Yonker Justin
Home Financials for this Owner
Home Financials are based on the most recent Mortgage that was taken out on this home.
Original Mortgage
$350,000
Interest Rate
3.85%
Mortgage Type
Purchase Money Mortgage
Create a Home Valuation Report for This Property
The Home Valuation Report is an in-depth analysis detailing your home's value as well as a comparison with similar homes in the area
Home Values in the Area
Average Home Value in this Area
Purchase History
| Date | Buyer | Sale Price | Title Company |
|---|---|---|---|
| Chen Lin Lin | $1,052,500 | Chicago Title Company | |
| Yonker Justin | -- | Chicago Title Company | |
| Hu Jack | -- | Chicago Title Company | |
| Hu Jack | $537,500 | Chicago Title Company |
Source: Public Records
Mortgage History
| Date | Status | Borrower | Loan Amount |
|---|---|---|---|
| Open | Chen Lin Lin | $625,500 | |
| Previous Owner | Hu Jack | $350,000 |
Source: Public Records
Tax History Compared to Growth
Tax History
| Year | Tax Paid | Tax Assessment Tax Assessment Total Assessment is a certain percentage of the fair market value that is determined by local assessors to be the total taxable value of land and additions on the property. | Land | Improvement |
|---|---|---|---|---|
| 2025 | $18,250 | $1,296,027 | $388,808 | $907,219 |
| 2024 | $18,250 | $1,270,620 | $381,186 | $889,434 |
| 2023 | $19,249 | $1,245,707 | $373,712 | $871,995 |
| 2022 | $18,816 | $1,221,288 | $366,386 | $854,902 |
| 2021 | $18,187 | $1,197,344 | $359,203 | $838,141 |
| 2020 | $17,984 | $1,185,072 | $355,521 | $829,551 |
| 2019 | $17,431 | $1,161,843 | $348,553 | $813,290 |
| 2018 | $17,054 | $1,139,067 | $341,720 | $797,347 |
| 2017 | $16,448 | $1,116,733 | $335,020 | $781,713 |
| 2016 | $16,020 | $1,094,841 | $328,452 | $766,389 |
| 2015 | $15,934 | $1,078,401 | $323,520 | $754,881 |
| 2014 | $16,054 | $1,057,277 | $317,183 | $740,094 |
Source: Public Records
Map
Nearby Homes
- 2093 Braemar Rd
- 4445 Arcadia Ave
- 1842 Brentwood Rd
- 1975 Wrenn St
- 4271 Whittle Ave
- 4751 Lincoln Ave
- 1942 Leimert Blvd
- 1989 Oakview Dr
- 4224 Lincoln Ave
- 37 Coolidge Terrace
- 180 Maiden Ln
- 5040 Pierpoint Ave
- 2471 Burlington St
- 2436 Potomac St
- 3073 Monterey Blvd
- 4081 Waterhouse Rd
- 2818 Steinmetz Way
- 3085 Monterey Blvd
- 389 Somerset Rd
- 2101 Braemar Rd
- 2117 Braemar Rd
- 65 Melvin Ct
- 2129 Braemar Rd
- 2098 Melvin Rd
- 2087 Braemar Rd
- 2108 Braemar Rd
- 2082 Melvin Rd
- 2100 Braemar Rd
- 2137 Braemar Rd
- 59 Melvin Ct
- 2090 Braemar Rd
- 2060 Melvin Rd
- 2108 Melvin Rd
- 55 Melvin Ct
- 2134 Melvin Rd
- 2128 Braemar Rd
- 2084 Braemar Rd
- 2069 Braemar Rd
- 2149 Braemar Rd