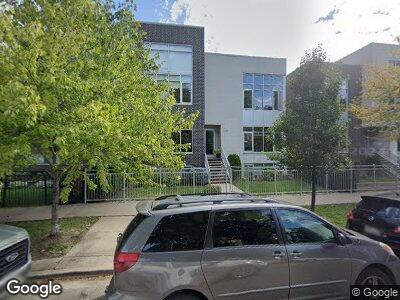
2109 N Campbell Ave Unit 2N Chicago, IL 60647
Logan Square NeighborhoodEstimated Value: $538,000 - $717,691
3
Beds
2
Baths
1,700
Sq Ft
$380/Sq Ft
Est. Value
About This Home
This home is located at 2109 N Campbell Ave Unit 2N, Chicago, IL 60647 and is currently estimated at $646,173, approximately $380 per square foot. 2109 N Campbell Ave Unit 2N is a home located in Cook County with nearby schools including Goethe Elementary School, Clemente Community Academy High School, and CICS - Bucktown Campus.
Ownership History
Date
Name
Owned For
Owner Type
Purchase Details
Closed on
Feb 25, 2022
Sold by
Chicago Title Land Trust Company
Bought by
Cooney Elizabeth D
Current Estimated Value
Home Financials for this Owner
Home Financials are based on the most recent Mortgage that was taken out on this home.
Original Mortgage
$515,000
Outstanding Balance
$485,304
Interest Rate
3.14%
Mortgage Type
New Conventional
Estimated Equity
$202,621
Purchase Details
Closed on
Dec 20, 2021
Sold by
Chicago Title Land Trust Company
Bought by
Cooney Elizabeth D
Home Financials for this Owner
Home Financials are based on the most recent Mortgage that was taken out on this home.
Original Mortgage
$515,000
Interest Rate
3.12%
Purchase Details
Closed on
Apr 19, 2017
Sold by
Biersmith Christopher F
Bought by
Chicago Title Land Trust Co and Trust Number 8002374411
Create a Home Valuation Report for This Property
The Home Valuation Report is an in-depth analysis detailing your home's value as well as a comparison with similar homes in the area
Home Values in the Area
Average Home Value in this Area
Purchase History
| Date | Buyer | Sale Price | Title Company |
|---|---|---|---|
| Cooney Elizabeth D | -- | Chicago Title | |
| Cooney Elizabeth D | -- | Chicago Title | |
| Cooney Elizabeth D | -- | -- | |
| Chicago Title Land Trust Co | $605,000 | North American Title |
Source: Public Records
Mortgage History
| Date | Status | Borrower | Loan Amount |
|---|---|---|---|
| Open | Cooney Elizabeth D | $515,000 | |
| Previous Owner | Cooney Elizabeth D | $515,000 | |
| Previous Owner | Cooney Elizabeth D | $0 | |
| Closed | Cooney Elizabeth D | $515,000 |
Source: Public Records
Tax History Compared to Growth
Tax History
| Year | Tax Paid | Tax Assessment Tax Assessment Total Assessment is a certain percentage of the fair market value that is determined by local assessors to be the total taxable value of land and additions on the property. | Land | Improvement |
|---|---|---|---|---|
| 2024 | $13,617 | $72,231 | $7,850 | $64,381 |
| 2023 | $13,617 | $65,981 | $3,575 | $62,406 |
| 2022 | $13,617 | $65,981 | $3,575 | $62,406 |
| 2021 | $13,311 | $65,979 | $3,574 | $62,405 |
| 2020 | $11,862 | $53,058 | $3,574 | $49,484 |
| 2019 | $11,833 | $58,681 | $3,574 | $55,107 |
| 2018 | $11,592 | $58,681 | $3,574 | $55,107 |
| 2017 | $8,503 | $42,875 | $3,154 | $39,721 |
| 2016 | $8,087 | $42,875 | $3,154 | $39,721 |
| 2015 | $7,376 | $42,875 | $3,154 | $39,721 |
| 2014 | $7,933 | $45,324 | $2,803 | $42,521 |
| 2013 | $8,243 | $45,324 | $2,803 | $42,521 |
Source: Public Records
Map
Nearby Homes
- 2109 N Campbell Ave Unit 2N
- 2735 N Campbell Ave
- 2133 N Campbell Ave Unit 2C
- 2133 N Campbell Ave Unit 2A
- 2052 N Campbell Ave Unit 3W
- 2212 N Campbell Ave Unit 2A
- 2328 W Charleston St
- 2131 N Claremont Ave Unit 1S
- 2325 W Shakespeare Ave
- 2207 N Western Ave Unit 2A
- 2014 N Western Ave
- 2512 W Lyndale St
- 2343 W Lyndale St Unit 2
- 2147 N Bingham St
- 2535 W Belden Ave
- 2062 N Bingham St
- 2540 W Armitage Ave Unit 2548
- 2246 W Palmer St
- 2215 N Talman Ave
- 2322 W Belden Ave Unit 1E
- 2109 N Campbell Ave Unit 2S
- 2109 N Campbell Ave Unit 1S
- 2109 N Campbell Ave Unit 2N
- 2109 N Campbell Ave Unit 1N
- 2109 N Campbell Ave
- 2109 N Campbell Ave
- 2109 N Campbell Ave Unit 2S
- 2109 N Campbell Ave Unit 1S
- 2109 N Campbell Ave Unit GS
- 2109 N Campbell Ave Unit 1N
- 2113 N Campbell Ave
- 2111 N Campbell Ave
- 2111 N Campbell Ave
- 2111 N Campbell Ave Unit 3F
- 2111 N Campbell Ave
- 2103 N Campbell Ave Unit 2N
- 2103 N Campbell Ave Unit 1N
- 2103 N Campbell Ave Unit 2S
- 2103 N Campbell Ave Unit 1S
- 2103 N Campbell Ave