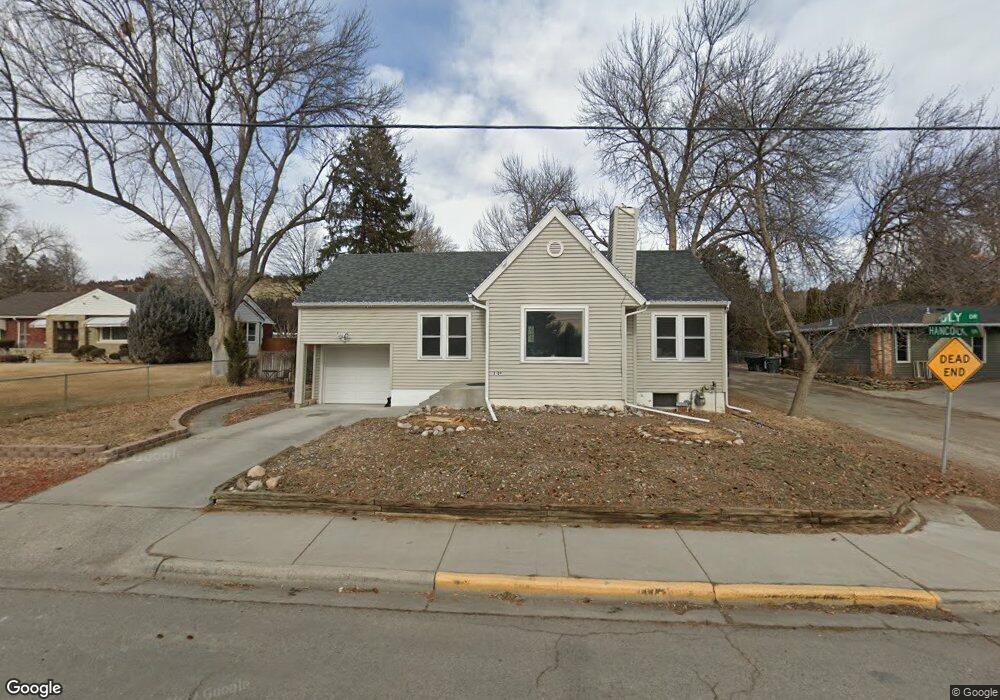
2109 Poly Dr Billings, MT 59102
North Central Billings NeighborhoodEstimated Value: $269,000 - $321,000
3
Beds
2
Baths
1,824
Sq Ft
$163/Sq Ft
Est. Value
About This Home
This home is located at 2109 Poly Dr, Billings, MT 59102 and is currently estimated at $296,661, approximately $162 per square foot. 2109 Poly Dr is a home located in Yellowstone County with nearby schools including Poly Drive School, Lewis & Clark Junior High School, and Billings Senior High School.
Ownership History
Date
Name
Owned For
Owner Type
Purchase Details
Closed on
Oct 15, 2021
Sold by
Thompson Michael and Thompson Laurie
Bought by
Hammond Rachel E
Current Estimated Value
Home Financials for this Owner
Home Financials are based on the most recent Mortgage that was taken out on this home.
Original Mortgage
$194,000
Outstanding Balance
$176,140
Interest Rate
2.8%
Mortgage Type
New Conventional
Estimated Equity
$120,521
Purchase Details
Closed on
Jun 1, 2009
Sold by
Goetz Elizabeth and Rath Elizabeth
Bought by
Thompson Michael and Thompson Laurie
Home Financials for this Owner
Home Financials are based on the most recent Mortgage that was taken out on this home.
Original Mortgage
$172,100
Interest Rate
4.8%
Mortgage Type
VA
Purchase Details
Closed on
Apr 22, 2005
Sold by
Hoover Kelly D and Hoover Lynda J
Bought by
Rath Elizabeth
Home Financials for this Owner
Home Financials are based on the most recent Mortgage that was taken out on this home.
Original Mortgage
$21,750
Interest Rate
5.99%
Mortgage Type
Stand Alone Second
Create a Home Valuation Report for This Property
The Home Valuation Report is an in-depth analysis detailing your home's value as well as a comparison with similar homes in the area
Home Values in the Area
Average Home Value in this Area
Purchase History
| Date | Buyer | Sale Price | Title Company |
|---|---|---|---|
| Hammond Rachel E | -- | First Montana Title Company | |
| Thompson Michael | -- | None Available | |
| Rath Elizabeth | -- | None Available |
Source: Public Records
Mortgage History
| Date | Status | Borrower | Loan Amount |
|---|---|---|---|
| Open | Hammond Rachel E | $194,000 | |
| Previous Owner | Thompson Michael | $172,100 | |
| Previous Owner | Rath Elizabeth | $21,750 | |
| Previous Owner | Rath Elizabeth | $116,000 |
Source: Public Records
Tax History
| Year | Tax Paid | Tax Assessment Tax Assessment Total Assessment is a certain percentage of the fair market value that is determined by local assessors to be the total taxable value of land and additions on the property. | Land | Improvement |
|---|---|---|---|---|
| 2025 | $2,396 | $307,000 | $50,372 | $256,628 |
| 2024 | $2,396 | $248,200 | $47,993 | $200,207 |
| 2023 | $2,399 | $248,200 | $47,993 | $200,207 |
| 2022 | $1,870 | $198,100 | $0 | $0 |
| 2021 | $2,055 | $195,900 | $0 | $0 |
| 2020 | $2,203 | $202,600 | $0 | $0 |
| 2019 | $2,102 | $202,600 | $0 | $0 |
| 2018 | $1,989 | $187,700 | $0 | $0 |
| 2017 | $1,932 | $187,700 | $0 | $0 |
| 2016 | $1,826 | $179,300 | $0 | $0 |
| 2015 | $1,785 | $179,300 | $0 | $0 |
| 2014 | $1,598 | $84,959 | $0 | $0 |
Source: Public Records
Map
Nearby Homes
- 2406 Woody Dr
- 2124 Dahlia Ln
- 1944 Colton Blvd
- 2042 Green Terrace Dr
- 2422 Brentwood Ln
- 2504 Rancho Rd
- 13 Stanford Ct
- 1745 Parkhill Dr
- 3226 Country Club Cir
- 2060 Edgewood Dr
- 1725 Avenue F
- 2644 Rimrock Rd
- 2646 Rimrock Rd
- 2721 Louise Ln
- 9 Shadow Place
- 1903 Forest Park Dr
- 3540 Masterson Cir
- 56 Shadow Place
- 2730 Gregory Dr S
- 2516 Lyndale Ln
Your Personal Tour Guide
Ask me questions while you tour the home.