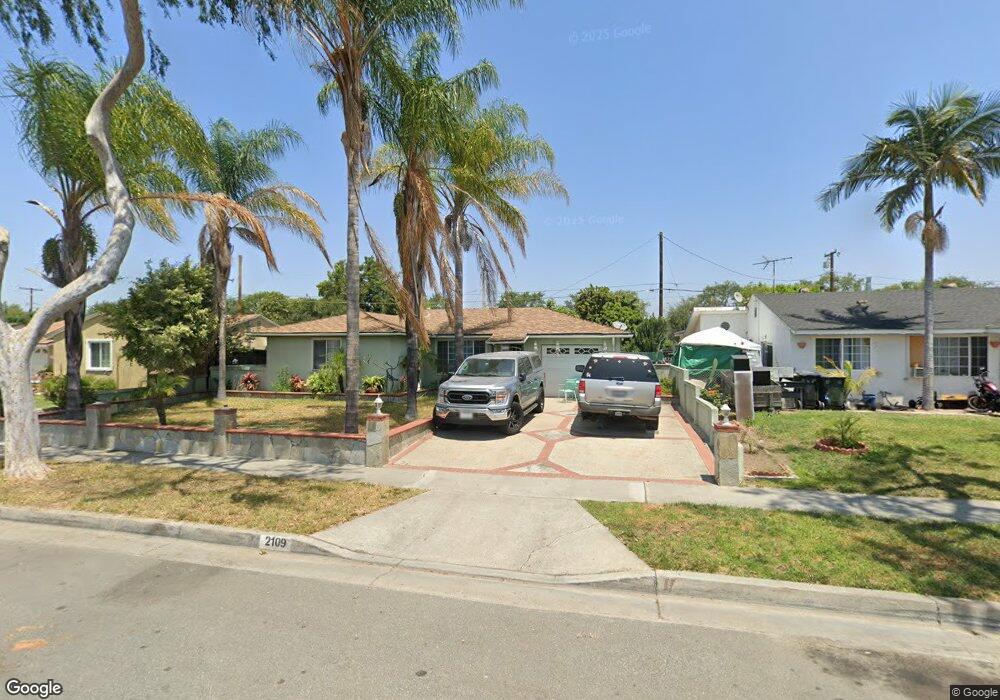
2109 W Walnut Ave Fullerton, CA 92833
Estimated Value: $718,000 - $820,000
3
Beds
1
Bath
960
Sq Ft
$809/Sq Ft
Est. Value
About This Home
This home is located at 2109 W Walnut Ave, Fullerton, CA 92833 and is currently estimated at $776,186, approximately $808 per square foot. 2109 W Walnut Ave is a home located in Orange County with nearby schools including Pacific Drive Elementary School, Nicolas Junior High School, and Buena Park High School.
Ownership History
Date
Name
Owned For
Owner Type
Purchase Details
Closed on
Apr 19, 2007
Sold by
Becerra Francisco J and Becerra Maria Elena
Bought by
Contreras Gerardo
Current Estimated Value
Purchase Details
Closed on
Feb 9, 2001
Sold by
Becerra Francisco J and Becerra Maria Elena
Bought by
Becerra Francisco J and Becerra Maria Elena
Home Financials for this Owner
Home Financials are based on the most recent Mortgage that was taken out on this home.
Original Mortgage
$170,166
Interest Rate
6.98%
Mortgage Type
FHA
Purchase Details
Closed on
Jul 20, 1998
Sold by
Glen Sutch and Glen Gail
Bought by
Becerra Francisco J and Becerra Maria Elena
Home Financials for this Owner
Home Financials are based on the most recent Mortgage that was taken out on this home.
Original Mortgage
$147,444
Interest Rate
6.88%
Mortgage Type
FHA
Purchase Details
Closed on
Nov 5, 1994
Sold by
Sutch Glen A and Sutch Gail E
Bought by
Sutch Glen A and Sutch Gail E
Create a Home Valuation Report for This Property
The Home Valuation Report is an in-depth analysis detailing your home's value as well as a comparison with similar homes in the area
Purchase History
We collect this data history from publicly available records. To have your information removed, we recommend requesting removal directly through your county’s website.
| Date | Buyer | Sale Price | Title Company |
|---|---|---|---|
| Contreras Gerardo | -- | None Available | |
| Becerra Francisco J | -- | American Title Co | |
| Becerra Francisco J | $150,000 | Benefit Land Title Company | |
| Sutch Glen A | -- | -- |
Source: Public Records
Mortgage History
We collect this data history from publicly available records. To have your information removed, we recommend requesting removal directly through your county’s website.
| Date | Status | Borrower | Loan Amount |
|---|---|---|---|
| Previous Owner | Becerra Francisco J | $170,166 | |
| Previous Owner | Becerra Francisco J | $147,444 |
Source: Public Records
Tax History
| Year | Tax Paid | Tax Assessment Tax Assessment Total Assessment is a certain percentage of the fair market value that is determined by local assessors to be the total taxable value of land and additions on the property. | Land | Improvement |
|---|---|---|---|---|
| 2025 | $5,270 | $466,481 | $410,237 | $56,244 |
| 2024 | $5,270 | $457,335 | $402,193 | $55,142 |
| 2023 | $5,143 | $448,368 | $394,307 | $54,061 |
| 2022 | $5,107 | $439,577 | $386,576 | $53,001 |
| 2021 | $5,019 | $430,958 | $378,996 | $51,962 |
| 2020 | $4,992 | $426,540 | $375,110 | $51,430 |
| 2019 | $4,864 | $418,177 | $367,755 | $50,422 |
| 2018 | $4,791 | $409,978 | $360,544 | $49,434 |
| 2017 | $4,712 | $401,940 | $353,475 | $48,465 |
| 2016 | $4,615 | $394,059 | $346,544 | $47,515 |
| 2015 | $4,488 | $388,140 | $341,338 | $46,802 |
| 2014 | $3,721 | $320,256 | $277,430 | $42,826 |
Source: Public Records
Map
Nearby Homes
- 2100 W Valencia Dr
- 313 Napa Ct
- 1909 W Walnut Ave
- 1913 W Valencia Dr
- 2101 W Ash Ave
- 134 S Pritchard Ave
- 108 S Pritchard Ave
- 228 Adlena Dr
- 1933 W Jacaranda Place
- 674 Bridgeport Cir Unit 25
- 1850 W Orangethorpe Ave Unit 44
- 1850 W Orangethorpe Ave Unit 25
- 2523 Cypress Point Dr
- 845 Whitewater Dr Unit 68
- 1467 W Flower Ave
- 2514 W Orangethorpe Ave Unit 2
- 2514 W Orangethorpe Ave Unit 35
- 224 Winetta Place
- 4032 W Valencia Dr
- 401 S Basque Ave
- 2113 W Walnut Ave
- 2105 W Walnut Ave
- 2117 W Walnut Ave
- 2101 W Walnut Ave
- 200 Ventura Place
- 201 Ventura Place
- 1922 Carol Dr
- 2000 Carol Dr
- 1916 Carol Dr
- 2021 W Walnut Ave
- 2121 W Walnut Ave
- 2006 Carol Dr
- 1910 Carol Dr
- 206 Ventura Place
- 207 Ventura Place
- 201 Napa Place
- 200 S Pine Dr
- 2012 Carol Dr
- 2019 W Walnut Ave
- 2125 W Walnut Ave
Your Personal Tour Guide
Ask me questions while you tour the home.