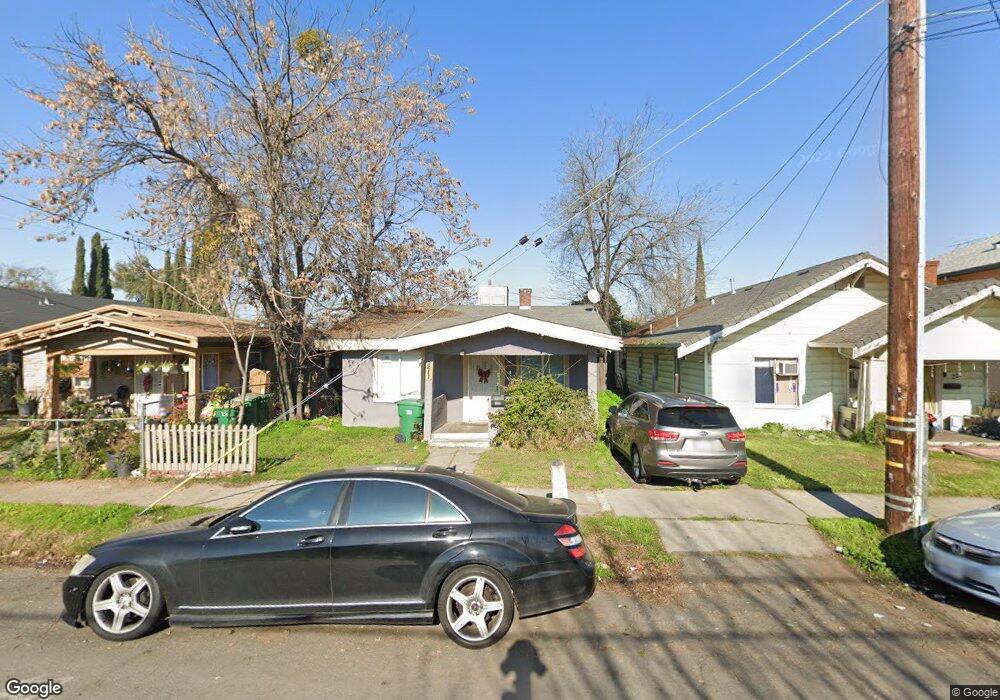
211 E Clay St Stockton, CA 95206
Seaport NeighborhoodEstimated Value: $233,000 - $319,000
2
Beds
1
Bath
928
Sq Ft
$295/Sq Ft
Est. Value
About This Home
This home is located at 211 E Clay St, Stockton, CA 95206 and is currently estimated at $274,052, approximately $295 per square foot. 211 E Clay St is a home located in San Joaquin County with nearby schools including Dolores Huerta Elementary School, Spanos (Alex G.) Elementary School, and Hazelton Elementary School.
Ownership History
Date
Name
Owned For
Owner Type
Purchase Details
Closed on
Oct 7, 2019
Sold by
Corrales Maria
Bought by
Piedra Juan
Current Estimated Value
Purchase Details
Closed on
Apr 9, 2018
Sold by
Piedra Real Estate Properties Inc
Bought by
Corrales Maria
Purchase Details
Closed on
Aug 29, 2017
Sold by
Estrella Realty Investments Llc
Bought by
Piedra Real Estate Properties Inc
Purchase Details
Closed on
Jun 30, 2015
Sold by
Thompson A Anne
Bought by
Estrella Realty Investments Llc
Create a Home Valuation Report for This Property
The Home Valuation Report is an in-depth analysis detailing your home's value as well as a comparison with similar homes in the area
Home Values in the Area
Average Home Value in this Area
Purchase History
| Date | Buyer | Sale Price | Title Company |
|---|---|---|---|
| Piedra Juan | $142,000 | None Available | |
| Corrales Maria | $25,000 | Placer Title Company | |
| Piedra Real Estate Properties Inc | -- | None Available | |
| Estrella Realty Investments Llc | $51,000 | Placer Title Company |
Source: Public Records
Tax History Compared to Growth
Tax History
| Year | Tax Paid | Tax Assessment Tax Assessment Total Assessment is a certain percentage of the fair market value that is determined by local assessors to be the total taxable value of land and additions on the property. | Land | Improvement |
|---|---|---|---|---|
| 2025 | $4,652 | $233,465 | $84,896 | $148,569 |
| 2024 | $2,837 | $228,888 | $83,232 | $145,656 |
| 2023 | $2,773 | $224,400 | $81,600 | $142,800 |
| 2022 | $2,739 | $220,000 | $80,000 | $140,000 |
| 2021 | $1,740 | $141,908 | $52,558 | $89,350 |
| 2020 | $713 | $55,203 | $16,236 | $38,967 |
| 2019 | $710 | $54,121 | $15,918 | $38,203 |
| 2018 | $697 | $53,060 | $15,606 | $37,454 |
| 2017 | $661 | $52,020 | $15,300 | $36,720 |
| 2016 | $565 | $42,563 | $17,025 | $25,538 |
| 2015 | $564 | $41,924 | $16,770 | $25,154 |
| 2014 | $4,966 | $41,103 | $16,441 | $24,662 |
Source: Public Records
Map
Nearby Homes
- 1125 S Sutter St
- 320 E Jefferson St
- 1516 S Hunter St
- 1120 S California St
- 1554 S San Joaquin St
- 446 E Anderson St
- 1444 S California St
- 1602 S Sutter St
- 609 E Jefferson St
- 1249 S Madison St
- 647 E 1st St
- 1145 S Grant St
- 711 Oso St
- 739 E 2nd St
- 416 W Jackson St
- 1827 S California St
- 231 E 5th St
- 921 S Aurora St
- 525 S California St
- 520 W Jackson St
- 221 E Clay St
- 225 E Clay St
- 1228 S Hunter St
- 203 E Clay St
- 1224 S Hunter St
- 1241 S San Joaquin St
- 1235 S San Joaquin St
- 1220 S Hunter St
- 1229 S San Joaquin St
- 212 E Clay St
- 220 E Clay St
- 204 E Clay St
- 230 E Clay St
- 224 E Jackson St
- 1305 S San Joaquin St
- 216 E Jackson St
- 1235 S Hunter St
- 212 E Jackson St
- 228 E Jackson St
- 206 E Jackson St