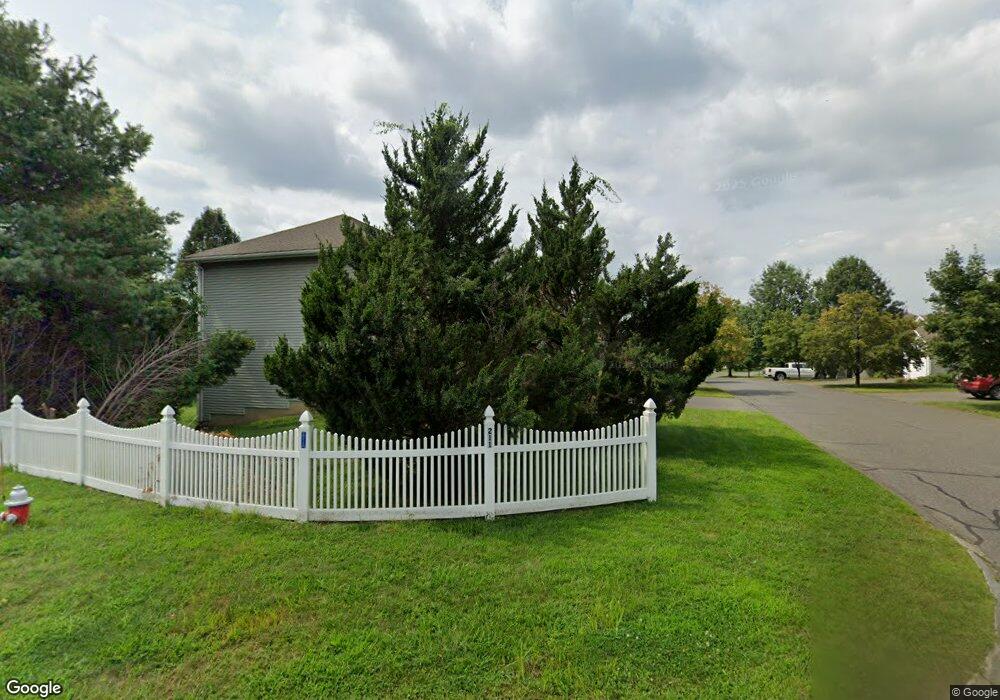
211 East St Unit 22 Easthampton, MA 01027
Estimated Value: $274,000 - $414,000
2
Beds
2
Baths
1,286
Sq Ft
$282/Sq Ft
Est. Value
About This Home
This home is located at 211 East St Unit 22, Easthampton, MA 01027 and is currently estimated at $362,791, approximately $282 per square foot. 211 East St Unit 22 is a home located in Hampshire County with nearby schools including Easthampton High School, Hilltown Cooperative Charter Public School, and Tri-County Schools.
Ownership History
Date
Name
Owned For
Owner Type
Purchase Details
Closed on
Jan 24, 2023
Sold by
Mary Tremble Ft
Bought by
Zawacki Aimee
Current Estimated Value
Purchase Details
Closed on
Jun 28, 2010
Sold by
Alexander Maurice J
Bought by
Tremble Mary Rita
Purchase Details
Closed on
Oct 15, 2009
Sold by
Rose Moya C and Daily Erinn C
Bought by
Tremble Mary Rita and Alexander Maurice J
Home Financials for this Owner
Home Financials are based on the most recent Mortgage that was taken out on this home.
Original Mortgage
$155,000
Interest Rate
5.14%
Mortgage Type
Purchase Money Mortgage
Purchase Details
Closed on
Jun 28, 2006
Sold by
Ara Dev Inc
Bought by
Daily Erinn C and Rose Moya C
Home Financials for this Owner
Home Financials are based on the most recent Mortgage that was taken out on this home.
Original Mortgage
$167,920
Interest Rate
6.58%
Mortgage Type
Purchase Money Mortgage
Create a Home Valuation Report for This Property
The Home Valuation Report is an in-depth analysis detailing your home's value as well as a comparison with similar homes in the area
Home Values in the Area
Average Home Value in this Area
Purchase History
| Date | Buyer | Sale Price | Title Company |
|---|---|---|---|
| Zawacki Aimee | -- | None Available | |
| Tremble Mary Rita | -- | -- | |
| Tremble Mary Rita | $215,000 | -- | |
| Daily Erinn C | $209,900 | -- |
Source: Public Records
Mortgage History
| Date | Status | Borrower | Loan Amount |
|---|---|---|---|
| Previous Owner | Tremble Mary Rita | $155,000 | |
| Previous Owner | Daily Erinn C | $167,920 |
Source: Public Records
Tax History Compared to Growth
Tax History
| Year | Tax Paid | Tax Assessment Tax Assessment Total Assessment is a certain percentage of the fair market value that is determined by local assessors to be the total taxable value of land and additions on the property. | Land | Improvement |
|---|---|---|---|---|
| 2025 | $4,459 | $326,200 | $0 | $326,200 |
| 2024 | $4,243 | $312,900 | $0 | $312,900 |
| 2023 | $3,378 | $230,600 | $0 | $230,600 |
| 2022 | $3,812 | $230,600 | $0 | $230,600 |
| 2021 | $4,185 | $238,600 | $0 | $238,600 |
| 2020 | $4,095 | $230,600 | $0 | $230,600 |
| 2019 | $3,115 | $201,500 | $0 | $201,500 |
| 2018 | $3,075 | $192,200 | $0 | $192,200 |
| 2017 | $2,996 | $184,800 | $0 | $184,800 |
| 2016 | $2,961 | $189,900 | $0 | $189,900 |
| 2015 | $2,877 | $189,900 | $0 | $189,900 |
Source: Public Records
Map
Nearby Homes
- 108 Parsons St
- 10 Glen Cove Place Unit A
- 12 Glen Cove Place Unit B
- 2 Clinton St
- 98 Everett St
- 52-54 Everett St
- 33 Knipfer Ave
- 19 Nicols Way Unit 19
- 78 Holyoke St
- 457 Northampton St
- 52 Williston Ave
- 5 Lownds Ave
- 56 Olive St
- 38 West St
- Lot 1 Edgewater Ln
- 57 Columbus Ave
- 86 Lyman Rd
- 125 Park St
- 33 Howard Ave
- 12 School St
- 211 East St Unit 32
- 211 East St Unit 31
- 211 East St Unit 30
- 211 East St Unit 29
- 211 East St Unit 28
- 211 East St Unit 27
- 211 East St Unit 26
- 211 East St Unit 25
- 211 East St Unit 24
- 211 East St Unit 23
- 211 East St Unit 21
- 211 East St Unit 19
- 211 East St Unit 17
- 211 East St Unit 16
- 211 East St Unit 15
- 211 East St Unit 14
- 211 East St Unit 13
- 211 East St Unit 12
- 211 East St Unit 11
- 211 East St Unit 10