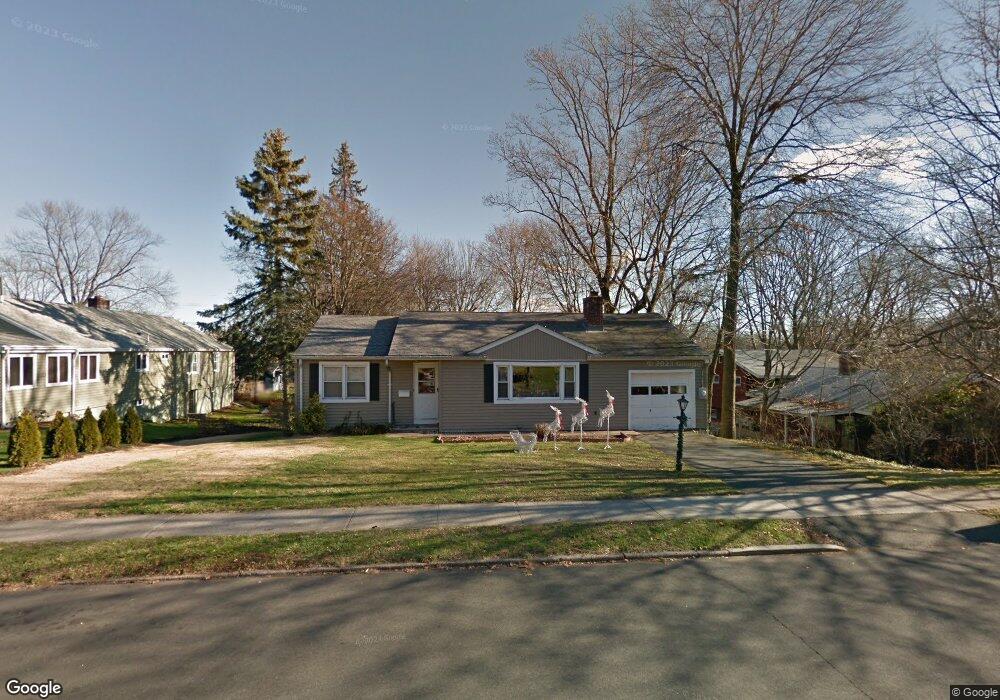
211 Hepburn Rd Hamden, CT 06517
Estimated Value: $336,000 - $400,000
3
Beds
1
Bath
1,242
Sq Ft
$293/Sq Ft
Est. Value
About This Home
This home is located at 211 Hepburn Rd, Hamden, CT 06517 and is currently estimated at $363,421, approximately $292 per square foot. 211 Hepburn Rd is a home located in New Haven County with nearby schools including Field Elementary School, Ridge Hill School, and Hamden Middle School.
Ownership History
Date
Name
Owned For
Owner Type
Purchase Details
Closed on
Oct 7, 2021
Sold by
Battipaglia Christopher J
Bought by
Battipagalia Tracie M
Current Estimated Value
Home Financials for this Owner
Home Financials are based on the most recent Mortgage that was taken out on this home.
Original Mortgage
$184,000
Outstanding Balance
$167,426
Interest Rate
2.8%
Mortgage Type
Stand Alone Refi Refinance Of Original Loan
Estimated Equity
$195,995
Purchase Details
Closed on
Oct 1, 1999
Sold by
Palmieri Louise M
Bought by
Maraucci Tracie and Battipaglia Chris
Home Financials for this Owner
Home Financials are based on the most recent Mortgage that was taken out on this home.
Original Mortgage
$91,200
Interest Rate
7.85%
Create a Home Valuation Report for This Property
The Home Valuation Report is an in-depth analysis detailing your home's value as well as a comparison with similar homes in the area
Home Values in the Area
Average Home Value in this Area
Purchase History
| Date | Buyer | Sale Price | Title Company |
|---|---|---|---|
| Battipagalia Tracie M | -- | None Available | |
| Battipagalia Tracie M | -- | None Available | |
| Maraucci Tracie | $114,000 | -- | |
| Maraucci Tracie | $114,000 | -- |
Source: Public Records
Mortgage History
| Date | Status | Borrower | Loan Amount |
|---|---|---|---|
| Open | Battipagalia Tracie M | $184,000 | |
| Previous Owner | Maraucci Tracie | $211,640 | |
| Previous Owner | Maraucci Tracie | $175,000 | |
| Previous Owner | Maraucci Tracie | $91,200 |
Source: Public Records
Tax History Compared to Growth
Tax History
| Year | Tax Paid | Tax Assessment Tax Assessment Total Assessment is a certain percentage of the fair market value that is determined by local assessors to be the total taxable value of land and additions on the property. | Land | Improvement |
|---|---|---|---|---|
| 2025 | $10,470 | $201,810 | $56,000 | $145,810 |
| 2024 | $7,400 | $133,070 | $42,140 | $90,930 |
| 2023 | $7,250 | $128,590 | $42,140 | $86,450 |
| 2022 | $7,134 | $128,590 | $42,140 | $86,450 |
| 2021 | $6,743 | $128,590 | $42,140 | $86,450 |
| 2020 | $5,967 | $114,800 | $54,040 | $60,760 |
| 2019 | $5,609 | $114,800 | $54,040 | $60,760 |
| 2018 | $5,506 | $114,800 | $54,040 | $60,760 |
| 2017 | $5,196 | $114,800 | $54,040 | $60,760 |
| 2016 | $5,207 | $114,800 | $54,040 | $60,760 |
| 2015 | $5,687 | $139,160 | $72,100 | $67,060 |
| 2014 | $5,557 | $139,160 | $72,100 | $67,060 |
Source: Public Records
Map
Nearby Homes
- 60 Allene Dr
- 2390 State St Unit 7D
- 15 Smith Dr
- 43 Stevens St
- 78 Edgecomb St
- 520 Hartford Turnpike
- 410 Waite St
- 47 Williamson Rd
- 780 Ridge Rd
- 43 Mulberry Hill
- 317 Franklin Rd
- 55 Ranch Rd
- 780 Hartford Turnpike
- 207 Franklin Rd
- 37 Quaker Rd
- 56 Dessa Dr
- 163 Waite St
- 36 Ford St
- 2022 Whitney Ave
- 1412 Whitney Ave Unit F3