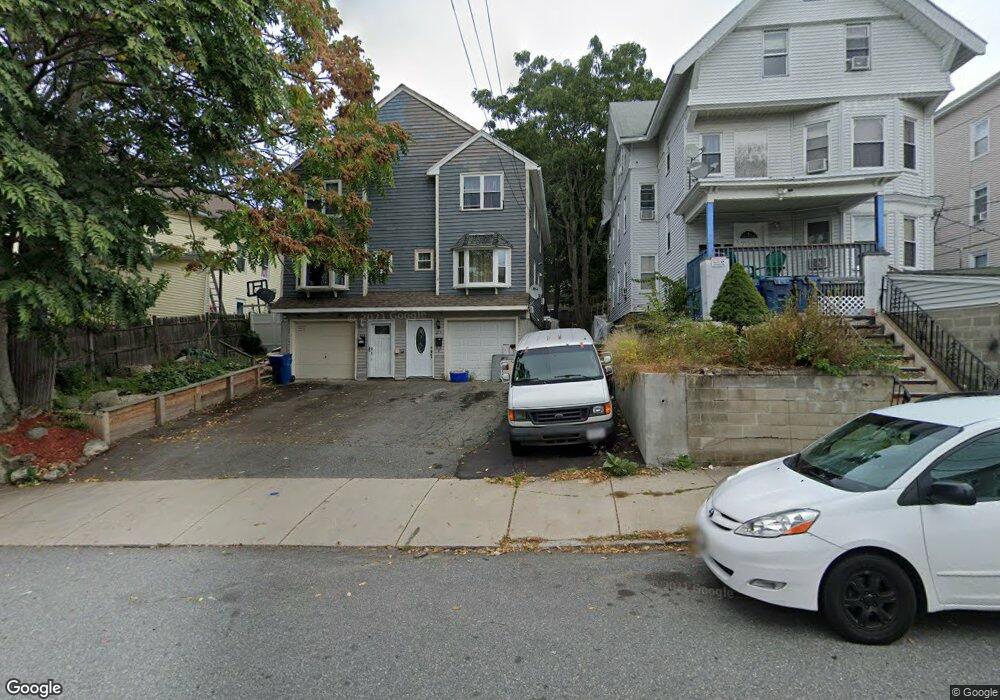
211 High St Lawrence, MA 01841
Prospect Hill-Back Bay NeighborhoodEstimated Value: $325,000 - $397,000
2
Beds
2
Baths
1,096
Sq Ft
$326/Sq Ft
Est. Value
About This Home
This home is located at 211 High St, Lawrence, MA 01841 and is currently estimated at $357,682, approximately $326 per square foot. 211 High St is a home located in Essex County with nearby schools including School For Exceptional Studies, Community Day Charter Public School - Gateway, and Esperanza Academy School of Hope.
Ownership History
Date
Name
Owned For
Owner Type
Purchase Details
Closed on
Jul 5, 2017
Sold by
Ulloa Angela
Bought by
Ulloa Johanny M
Current Estimated Value
Purchase Details
Closed on
Dec 26, 2006
Sold by
Bishop Richard
Bought by
Ulloa Angela
Home Financials for this Owner
Home Financials are based on the most recent Mortgage that was taken out on this home.
Original Mortgage
$124,000
Interest Rate
6.35%
Mortgage Type
Purchase Money Mortgage
Purchase Details
Closed on
Oct 1, 2004
Sold by
Washington Mutual Bank
Bought by
Bishop Richard
Home Financials for this Owner
Home Financials are based on the most recent Mortgage that was taken out on this home.
Original Mortgage
$91,200
Interest Rate
5.81%
Mortgage Type
Purchase Money Mortgage
Purchase Details
Closed on
Nov 30, 1989
Sold by
Griffin Warren
Bought by
Saad Hussein
Home Financials for this Owner
Home Financials are based on the most recent Mortgage that was taken out on this home.
Original Mortgage
$85,500
Interest Rate
9.82%
Mortgage Type
Purchase Money Mortgage
Create a Home Valuation Report for This Property
The Home Valuation Report is an in-depth analysis detailing your home's value as well as a comparison with similar homes in the area
Home Values in the Area
Average Home Value in this Area
Purchase History
| Date | Buyer | Sale Price | Title Company |
|---|---|---|---|
| Ulloa Johanny M | -- | -- | |
| Ulloa Angela | $155,000 | -- | |
| Bishop Richard | $114,000 | -- | |
| Washington Mutual Bank | -- | -- | |
| Saad Hussein | $95,000 | -- |
Source: Public Records
Mortgage History
| Date | Status | Borrower | Loan Amount |
|---|---|---|---|
| Previous Owner | Ulloa Angela | $124,000 | |
| Previous Owner | Ulloa Angela | $31,000 | |
| Previous Owner | Bishop Richard | $91,200 | |
| Previous Owner | Saad Hussein | $85,500 |
Source: Public Records
Tax History
| Year | Tax Paid | Tax Assessment Tax Assessment Total Assessment is a certain percentage of the fair market value that is determined by local assessors to be the total taxable value of land and additions on the property. | Land | Improvement |
|---|---|---|---|---|
| 2025 | $2,473 | $281,000 | $0 | $281,000 |
| 2024 | $2,535 | $274,000 | $0 | $274,000 |
| 2023 | $2,476 | $243,700 | $0 | $243,700 |
| 2022 | $2,391 | $209,000 | $0 | $209,000 |
| 2021 | $2,282 | $186,000 | $0 | $186,000 |
| 2020 | $2,169 | $174,500 | $0 | $174,500 |
| 2019 | $1,897 | $138,700 | $0 | $138,700 |
| 2018 | $1,780 | $124,300 | $0 | $124,300 |
| 2017 | $1,730 | $112,800 | $0 | $112,800 |
| 2016 | $1,466 | $94,500 | $0 | $94,500 |
| 2015 | $1,429 | $94,500 | $0 | $94,500 |
Source: Public Records
Map
Nearby Homes
- 162 E Haverhill St
- 109 Ferry St
- 192 Union St
- 80-82 Haverhill St
- 89 Newbury St Unit 89B
- 91 Summer St Unit 2
- 2 Cherry St
- 52 Howard St
- 5 Kendrick St
- 7 Stevens Ct
- 27 Woodland Ct
- 264 E Haverhill St Unit 2
- 106 Leroy Ave
- 39 Swan Ave
- 32 Josephine Ave
- 131A Lawrence St Unit 40
- 14 Court St
- 11 Lawrence St Unit 606
- 71-75 Common St
- 18 Erhardt Terrace
- 211 High St Unit 211
- 211 High St Unit 1
- 213 High St
- 209 High St
- 215 High St
- 28-30 Platt St
- 28 Platt St Unit 30
- 207 High St Unit 2
- 205 High St Unit 207
- 26 Platt St
- 199 High St
- 31 Platt St
- 220 High St Unit 2
- 27 Platt St
- 202 High St
- 222 High St
- 4 Plisch Way
- 206 High St Unit 208
- 2 Plisch Way
- 195 High St
Your Personal Tour Guide
Ask me questions while you tour the home.