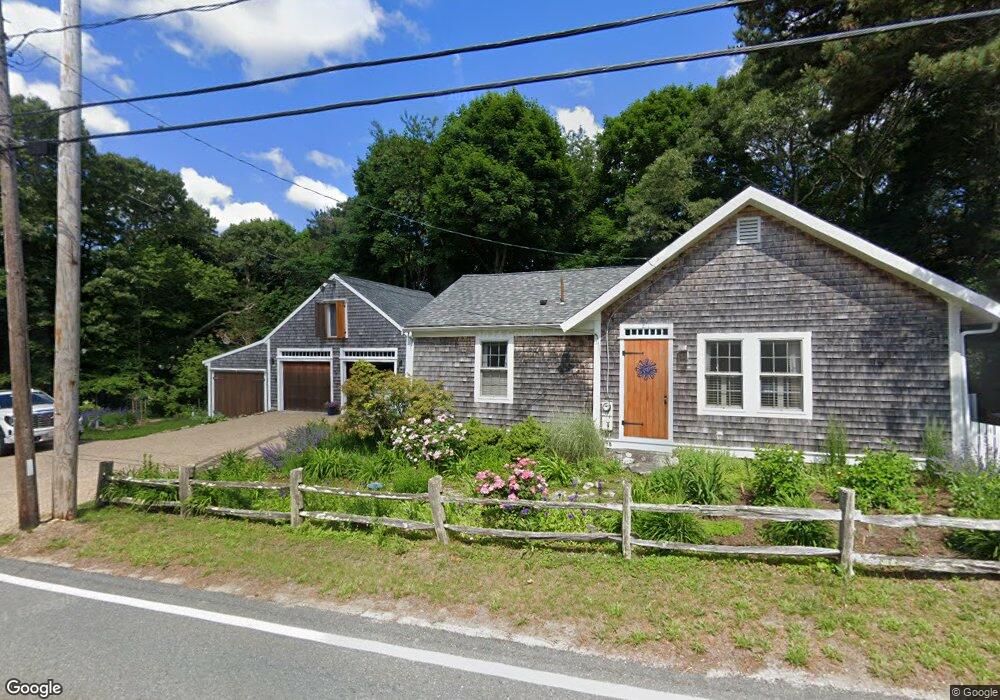
211 Maple St West Barnstable, MA 02668
West Barnstable NeighborhoodEstimated Value: $589,366 - $764,000
2
Beds
2
Baths
1,001
Sq Ft
$673/Sq Ft
Est. Value
About This Home
This home is located at 211 Maple St, West Barnstable, MA 02668 and is currently estimated at $673,842, approximately $673 per square foot. 211 Maple St is a home located in Barnstable County with nearby schools including West Barnstable Elementary School, Barnstable United Elementary School, and Barnstable Intermediate School.
Ownership History
Date
Name
Owned For
Owner Type
Purchase Details
Closed on
Jul 14, 2016
Sold by
Ojala Arne H and Ojala Sarah B
Bought by
Shark City Finn Town R
Current Estimated Value
Purchase Details
Closed on
Feb 14, 2003
Sold by
Butler Norma Y
Bought by
Ojala Arne H
Home Financials for this Owner
Home Financials are based on the most recent Mortgage that was taken out on this home.
Original Mortgage
$224,800
Interest Rate
5.88%
Mortgage Type
Purchase Money Mortgage
Purchase Details
Closed on
Jun 10, 1996
Sold by
Young Nt
Bought by
Butler Norma Y
Home Financials for this Owner
Home Financials are based on the most recent Mortgage that was taken out on this home.
Original Mortgage
$60,000
Interest Rate
7.89%
Mortgage Type
Purchase Money Mortgage
Purchase Details
Closed on
Aug 30, 1989
Sold by
Ott David E
Bought by
Young Saimi M
Create a Home Valuation Report for This Property
The Home Valuation Report is an in-depth analysis detailing your home's value as well as a comparison with similar homes in the area
Home Values in the Area
Average Home Value in this Area
Purchase History
| Date | Buyer | Sale Price | Title Company |
|---|---|---|---|
| Shark City Finn Town R | -- | -- | |
| Ojala Arne H | $249,800 | -- | |
| Butler Norma Y | $75,000 | -- | |
| Young Saimi M | $120,000 | -- |
Source: Public Records
Mortgage History
| Date | Status | Borrower | Loan Amount |
|---|---|---|---|
| Previous Owner | Young Saimi M | $214,000 | |
| Previous Owner | Young Saimi M | $224,800 | |
| Previous Owner | Young Saimi M | $100,000 | |
| Previous Owner | Young Saimi M | $60,000 |
Source: Public Records
Tax History Compared to Growth
Tax History
| Year | Tax Paid | Tax Assessment Tax Assessment Total Assessment is a certain percentage of the fair market value that is determined by local assessors to be the total taxable value of land and additions on the property. | Land | Improvement |
|---|---|---|---|---|
| 2025 | $4,575 | $489,800 | $168,700 | $321,100 |
| 2024 | $4,150 | $483,700 | $168,700 | $315,000 |
| 2023 | $4,004 | $439,500 | $166,700 | $272,800 |
| 2022 | $3,952 | $355,700 | $118,500 | $237,200 |
| 2021 | $0 | $313,500 | $118,500 | $195,000 |
| 2020 | $3,337 | $275,300 | $118,500 | $156,800 |
| 2019 | $3,156 | $257,000 | $118,500 | $138,500 |
| 2018 | $0 | $246,400 | $130,000 | $116,400 |
| 2017 | $2,942 | $240,400 | $130,000 | $110,400 |
| 2016 | $2,909 | $242,600 | $132,200 | $110,400 |
| 2015 | $2,909 | $243,200 | $126,100 | $117,100 |
Source: Public Records
Map
Nearby Homes