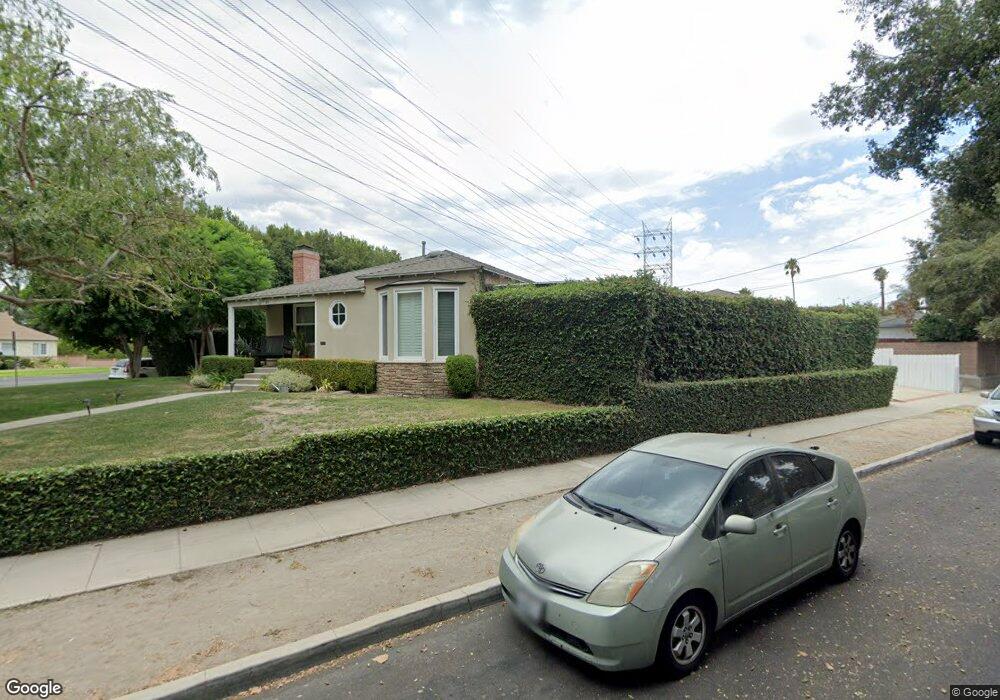
211 N Fairview St Burbank, CA 91505
Media District NeighborhoodEstimated Value: $982,000 - $1,229,000
2
Beds
2
Baths
1,222
Sq Ft
$911/Sq Ft
Est. Value
About This Home
This home is located at 211 N Fairview St, Burbank, CA 91505 and is currently estimated at $1,113,321, approximately $911 per square foot. 211 N Fairview St is a home located in Los Angeles County with nearby schools including R. L. Stevenson Elementary School, Dolores Huerta Middle School, and John Burroughs High School.
Ownership History
Date
Name
Owned For
Owner Type
Purchase Details
Closed on
Feb 11, 2026
Sold by
Hayley Hicks and Grace Chochola
Bought by
Hicks-Chochola Trust and Hicks
Current Estimated Value
Purchase Details
Closed on
Aug 31, 2020
Sold by
Hicks Hayley C and Chochola Grace L
Bought by
Hicks Hayley C and Chochola Grace L
Home Financials for this Owner
Home Financials are based on the most recent Mortgage that was taken out on this home.
Original Mortgage
$510,400
Interest Rate
2.9%
Mortgage Type
New Conventional
Purchase Details
Closed on
Aug 28, 2013
Sold by
Dillon Sheri Lynn and Sheri Lyn Dillon Trust
Bought by
Hicks Hayley C and Chochola Grace L
Home Financials for this Owner
Home Financials are based on the most recent Mortgage that was taken out on this home.
Original Mortgage
$579,313
Interest Rate
4.46%
Mortgage Type
FHA
Purchase Details
Closed on
Mar 29, 2006
Sold by
Dillon Sheri Lyn
Bought by
Dillon Sheri Lynn and The Sheri Lynn Dillon Trust
Purchase Details
Closed on
Nov 23, 1994
Sold by
Rogers Suzan R
Bought by
Dillon Sheri Lyn
Home Financials for this Owner
Home Financials are based on the most recent Mortgage that was taken out on this home.
Original Mortgage
$153,000
Interest Rate
5.5%
Create a Home Valuation Report for This Property
The Home Valuation Report is an in-depth analysis detailing your home's value as well as a comparison with similar homes in the area
Home Values in the Area
Average Home Value in this Area
Purchase History
| Date | Buyer | Sale Price | Title Company |
|---|---|---|---|
| Hicks-Chochola Trust | -- | None Listed On Document | |
| Hicks Hayley | -- | None Listed On Document | |
| Hicks Hayley C | -- | Orange Coast Title Company | |
| Hicks Hayley C | $590,000 | North American Title | |
| Dillon Sheri Lynn | -- | None Available | |
| Dillon Sheri Lyn | $170,000 | Investors Title Company |
Source: Public Records
Mortgage History
| Date | Status | Borrower | Loan Amount |
|---|---|---|---|
| Previous Owner | Hicks Hayley C | $510,400 | |
| Previous Owner | Hicks Hayley C | $579,313 | |
| Previous Owner | Dillon Sheri Lyn | $153,000 |
Source: Public Records
Tax History
| Year | Tax Paid | Tax Assessment Tax Assessment Total Assessment is a certain percentage of the fair market value that is determined by local assessors to be the total taxable value of land and additions on the property. | Land | Improvement |
|---|---|---|---|---|
| 2025 | $8,021 | $723,247 | $578,601 | $144,646 |
| 2024 | $8,021 | $709,066 | $567,256 | $141,810 |
| 2023 | $7,936 | $695,164 | $556,134 | $139,030 |
| 2022 | $7,577 | $681,534 | $545,230 | $136,304 |
| 2021 | $7,549 | $668,172 | $534,540 | $133,632 |
| 2019 | $7,244 | $648,355 | $518,686 | $129,669 |
| 2018 | $7,149 | $635,643 | $508,516 | $127,127 |
| 2016 | $6,793 | $610,963 | $488,771 | $122,192 |
| 2015 | $6,656 | $601,787 | $481,430 | $120,357 |
| 2014 | $6,642 | $590,000 | $472,000 | $118,000 |
Source: Public Records
Map
Nearby Homes
- 2925 W Oak St
- 338 N Lima St
- 409 N Avon St
- 521 N California St
- 421 N Catalina St
- 544 N California St
- 613 N California St
- 216 N Buena Vista St Unit 113
- 531 N Niagara St
- 2907 W Riverside Dr
- 625 N Niagara St
- 355 N Maple St Unit 203
- 355 N Maple St Unit 121
- 2912 W Riverside Dr
- 121 N Myers St
- 211 S Keystone St
- 140 N Pass Ave
- 136 N Pass Ave
- 4101 W National Ave
- 118 N Evergreen St
- 214 N Whitnall Hwy
- 202 N Fairview St
- 216 N Whitnall Hwy
- 210 N Fairview St
- 216 N Fairview St
- 218 N Fairview St
- 222 N Whitnall Hwy
- 204 N Fairview St
- 222 N Fairview St
- 200 N Fairview St
- 203 N Whitnall Hwy
- 224 N Whitnall Hwy
- 226 N Fairview St
- 231 N Fairview St
- 140 N Fairview St
- 230 N Fairview St
- 211 N Whitnall Hwy
- 228 N Whitnall Hwy
- 215 N Whitnall Hwy
- 217 N Whitnall Hwy
Your Personal Tour Guide
Ask me questions while you tour the home.