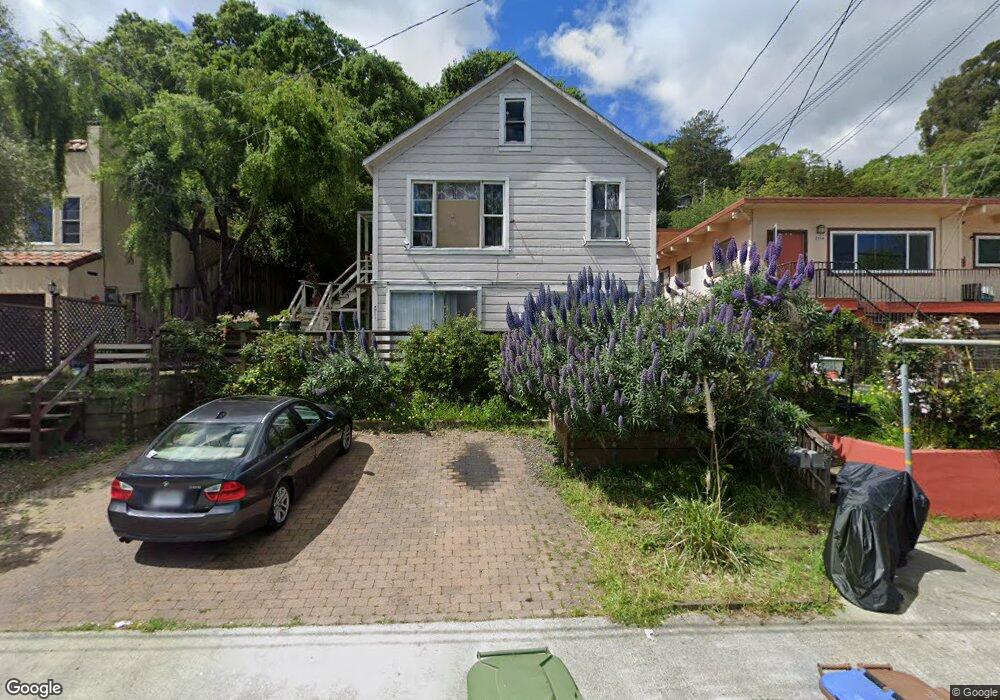
211 Picnic Ave San Rafael, CA 94901
Picnic Valley NeighborhoodEstimated Value: $1,087,000 - $1,346,000
6
Beds
2
Baths
1,897
Sq Ft
$629/Sq Ft
Est. Value
About This Home
This home is located at 211 Picnic Ave, San Rafael, CA 94901 and is currently estimated at $1,193,136, approximately $628 per square foot. 211 Picnic Ave is a home located in Marin County with nearby schools including Laurel Dell Elementary School, James B. Davidson Middle School, and San Rafael High School.
Ownership History
Date
Name
Owned For
Owner Type
Purchase Details
Closed on
Jul 23, 2025
Sold by
Arion G Monti Childrens Trust and Monti Rodney Nelson
Bought by
Monti Rodney N and Monti Barbara Ann
Current Estimated Value
Purchase Details
Closed on
Feb 18, 2002
Sold by
Monti Arion G
Bought by
Monti Stephen A and Monti Rodney N
Purchase Details
Closed on
Mar 20, 1994
Sold by
Monti Arion G
Bought by
Monti Arion G
Purchase Details
Closed on
Nov 19, 1993
Sold by
Monti Arion G
Bought by
Monti Arion G
Create a Home Valuation Report for This Property
The Home Valuation Report is an in-depth analysis detailing your home's value as well as a comparison with similar homes in the area
Home Values in the Area
Average Home Value in this Area
Purchase History
| Date | Buyer | Sale Price | Title Company |
|---|---|---|---|
| Monti Rodney N | -- | None Listed On Document | |
| Monti Family Trust | -- | None Listed On Document | |
| Monti Stephen A | -- | -- | |
| Monti Arion G | -- | -- | |
| Monti Arion G | -- | -- | |
| Monti Rodney Nelson | -- | -- | |
| Monti Arion G | -- | -- |
Source: Public Records
Tax History Compared to Growth
Tax History
| Year | Tax Paid | Tax Assessment Tax Assessment Total Assessment is a certain percentage of the fair market value that is determined by local assessors to be the total taxable value of land and additions on the property. | Land | Improvement |
|---|---|---|---|---|
| 2025 | $4,739 | $140,848 | $50,872 | $89,976 |
| 2024 | $4,739 | $138,086 | $49,874 | $88,212 |
| 2023 | $4,492 | $135,378 | $48,896 | $86,482 |
| 2022 | $4,362 | $132,725 | $47,938 | $84,787 |
| 2021 | $4,308 | $130,097 | $46,986 | $83,111 |
| 2020 | $4,226 | $128,763 | $46,504 | $82,259 |
| 2019 | $3,977 | $126,238 | $45,592 | $80,646 |
| 2018 | $3,940 | $123,763 | $44,698 | $79,065 |
| 2017 | $3,854 | $121,337 | $43,822 | $77,515 |
| 2016 | $2,872 | $118,958 | $42,963 | $75,995 |
| 2015 | $2,752 | $117,172 | $42,318 | $74,854 |
| 2014 | $2,612 | $114,877 | $41,489 | $73,388 |
Source: Public Records
Map
Nearby Homes