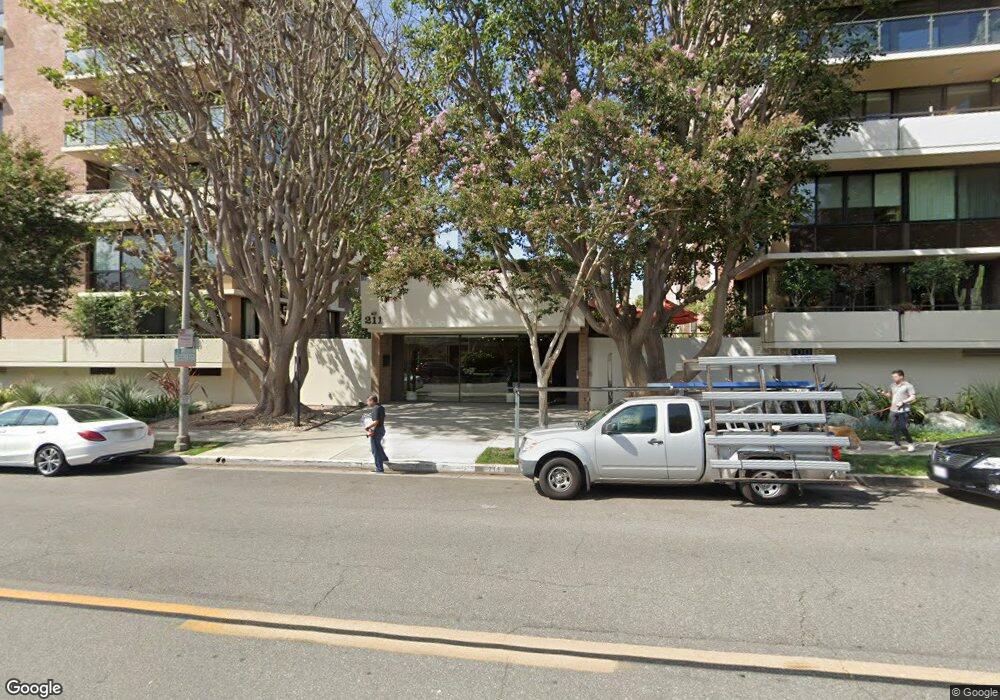
211 S Spalding Dr, Unit 401N Beverly Hills, CA 90212
Estimated Value: $2,143,000 - $2,719,000
2
Beds
3
Baths
2,365
Sq Ft
$1,023/Sq Ft
Est. Value
About This Home
This home is located at 211 S Spalding Dr Unit 401N, Beverly Hills, CA 90212 and is currently estimated at $2,419,022, approximately $1,022 per square foot. 211 S Spalding Dr Unit 401N is a home located in Los Angeles County with nearby schools including El Rodeo Elementary School, Beverly Hills High School, and Good Shepherd Catholic School.
Ownership History
Date
Name
Owned For
Owner Type
Purchase Details
Closed on
Mar 3, 2016
Sold by
Fendel Beatrice Joy
Bought by
The Collins Family Trust
Current Estimated Value
Purchase Details
Closed on
Oct 1, 2004
Sold by
Grauman Joseph and Grauman Mark
Bought by
Fendel William L
Purchase Details
Closed on
Nov 17, 1998
Sold by
Grauman Betty B
Bought by
Grauman Betty B and Betty B Grauman Family Trust
Purchase Details
Closed on
Jan 5, 1998
Sold by
Mossanen Nader
Bought by
Grauman Betty B
Purchase Details
Closed on
Dec 27, 1994
Sold by
Masamway Corp
Bought by
Mossanen Nader
Home Financials for this Owner
Home Financials are based on the most recent Mortgage that was taken out on this home.
Original Mortgage
$330,400
Interest Rate
7.54%
Create a Home Valuation Report for This Property
The Home Valuation Report is an in-depth analysis detailing your home's value as well as a comparison with similar homes in the area
Home Values in the Area
Average Home Value in this Area
Purchase History
| Date | Buyer | Sale Price | Title Company |
|---|---|---|---|
| The Collins Family Trust | $1,600,000 | Progressive Title Company | |
| Fendel William L | $1,210,000 | Equity Title Company | |
| Grauman Betty B | -- | -- | |
| Grauman Betty B | $600,000 | Stewart Title Company | |
| Mossanen Nader | $413,000 | Stewart Title |
Source: Public Records
Mortgage History
| Date | Status | Borrower | Loan Amount |
|---|---|---|---|
| Previous Owner | Mossanen Nader | $330,400 |
Source: Public Records
Tax History Compared to Growth
Tax History
| Year | Tax Paid | Tax Assessment Tax Assessment Total Assessment is a certain percentage of the fair market value that is determined by local assessors to be the total taxable value of land and additions on the property. | Land | Improvement |
|---|---|---|---|---|
| 2025 | $22,458 | $1,894,065 | $1,231,026 | $663,039 |
| 2024 | $22,458 | $1,856,928 | $1,206,889 | $650,039 |
| 2023 | $22,055 | $1,820,519 | $1,183,225 | $637,294 |
| 2022 | $21,423 | $1,784,824 | $1,160,025 | $624,799 |
| 2021 | $20,793 | $1,749,829 | $1,137,280 | $612,549 |
| 2019 | $20,192 | $1,697,931 | $1,103,549 | $594,382 |
| 2018 | $19,439 | $1,664,639 | $1,081,911 | $582,728 |
| 2016 | $2,640 | $224,454 | $144,124 | $80,330 |
| 2015 | $2,531 | $221,084 | $141,960 | $79,124 |
| 2014 | $2,458 | $216,755 | $139,180 | $77,575 |
Source: Public Records
About This Building
Map
Nearby Homes
- 211 S Spalding Dr Unit 205N
- 211 S Spalding Dr Unit 110N
- 211 S Spalding Dr Unit 107N
- 211 S Spalding Dr Unit 603S
- 215 S Mccarty Dr
- 9900 S Santa Monica Blvd Unit 2D
- 9900 S Santa Monica Blvd Unit 3A
- 9900 S Santa Monica Blvd Unit 2F
- 9900 S Santa Monica Blvd Unit PHE
- 9950 Durant Dr Unit 504
- 9950 Durant Dr Unit 406
- 9950 Durant Dr Unit 209
- 133 S Bedford Dr
- 305 S Mccarty Dr
- 321 S Linden Dr
- 9601 Charleville Blvd Unit 5
- 9601 Charleville Blvd Unit 10
- 332 S Mccarty Dr
- 620 Walden Dr
- 405 Shirley Place
- 211 S Spalding Dr Unit 105N
- 211 S Spalding Dr Unit S00204
- 211 S Spalding Dr Unit 106N
- 211 S Spalding Dr Unit TH 105s
- 211 S Spalding Dr Unit PH 5N
- 211 S Spalding Dr Unit TH 108s
- 211 S Spalding Dr Unit 604N
- 211 S Spalding Dr Unit 502S
- 211 S Spalding Dr Unit 405S
- 211 S Spalding Dr Unit 505S
- 211 S Spalding Dr Unit 401S
- 211 S Spalding Dr Unit 405N
- 211 S Spalding Dr Unit 306S
- 211 S Spalding Dr Unit 306N
- 211 S Spalding Dr Unit 205S
- 211 S Spalding Dr Unit 105S
- 211 S Spalding Dr Unit 204S
- 211 S Spalding Dr Unit 203N
- 211 S Spalding Dr Unit 202S
- 211 S Spalding Dr Unit 206N