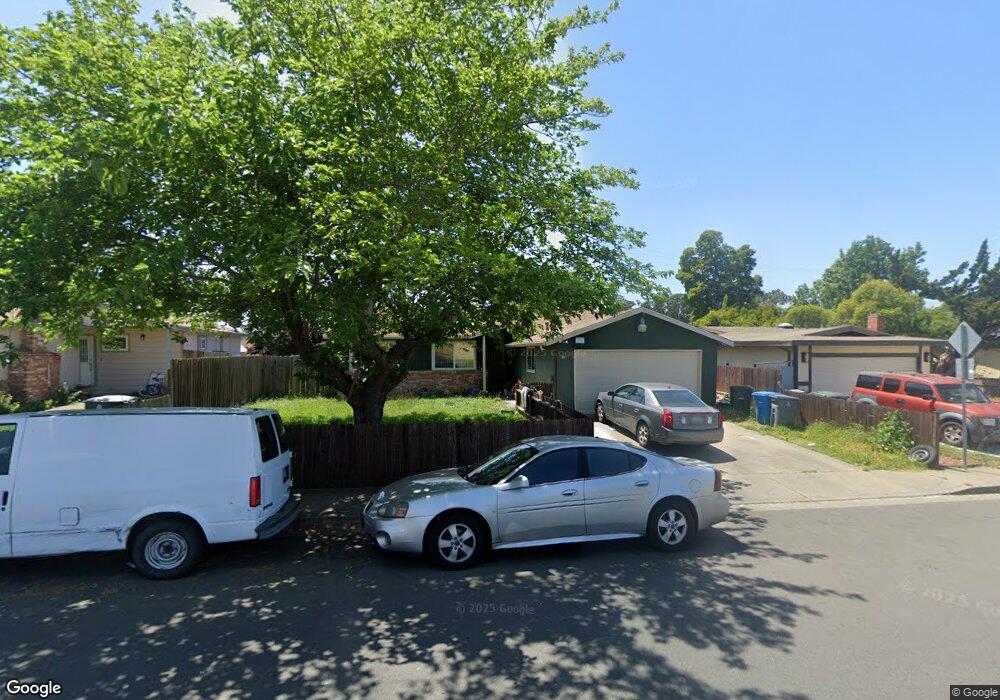
211 Stanford Dr Vallejo, CA 94589
North Vallejo NeighborhoodEstimated Value: $422,000 - $476,710
4
Beds
2
Baths
1,285
Sq Ft
$350/Sq Ft
Est. Value
About This Home
This home is located at 211 Stanford Dr, Vallejo, CA 94589 and is currently estimated at $449,428, approximately $349 per square foot. 211 Stanford Dr is a home located in Solano County with nearby schools including Elsa Widenmann Elementary, Solano Middle School, and Vallejo High School.
Ownership History
Date
Name
Owned For
Owner Type
Purchase Details
Closed on
Oct 21, 2019
Sold by
Gaddies Loretta H
Bought by
Gaddies Loretta Hope
Current Estimated Value
Home Financials for this Owner
Home Financials are based on the most recent Mortgage that was taken out on this home.
Original Mortgage
$290,787
Outstanding Balance
$254,744
Interest Rate
3.5%
Mortgage Type
New Conventional
Estimated Equity
$194,684
Purchase Details
Closed on
Apr 6, 2016
Sold by
Garcia Blanca R Raya
Bought by
Gaddies Loretta H
Home Financials for this Owner
Home Financials are based on the most recent Mortgage that was taken out on this home.
Original Mortgage
$299,475
Interest Rate
4.4%
Mortgage Type
FHA
Purchase Details
Closed on
Jul 10, 2012
Sold by
Bower Andrew P and Bower Bill
Bought by
Raya Bianca R
Home Financials for this Owner
Home Financials are based on the most recent Mortgage that was taken out on this home.
Original Mortgage
$147,283
Interest Rate
3.75%
Mortgage Type
FHA
Create a Home Valuation Report for This Property
The Home Valuation Report is an in-depth analysis detailing your home's value as well as a comparison with similar homes in the area
Home Values in the Area
Average Home Value in this Area
Purchase History
| Date | Buyer | Sale Price | Title Company |
|---|---|---|---|
| Gaddies Loretta Hope | -- | Old Republic Title Company | |
| Gaddies Loretta H | $305,000 | Old Republic Title Company | |
| Raya Bianca R | $150,000 | Old Republic Title Company |
Source: Public Records
Mortgage History
| Date | Status | Borrower | Loan Amount |
|---|---|---|---|
| Open | Gaddies Loretta Hope | $290,787 | |
| Closed | Gaddies Loretta H | $299,475 | |
| Previous Owner | Raya Bianca R | $147,283 |
Source: Public Records
Tax History
| Year | Tax Paid | Tax Assessment Tax Assessment Total Assessment is a certain percentage of the fair market value that is determined by local assessors to be the total taxable value of land and additions on the property. | Land | Improvement |
|---|---|---|---|---|
| 2025 | $5,058 | $361,050 | $94,699 | $266,351 |
| 2024 | $5,058 | $353,972 | $92,843 | $261,129 |
| 2023 | $4,776 | $347,032 | $91,023 | $256,009 |
| 2022 | $4,686 | $340,229 | $89,239 | $250,990 |
| 2021 | $4,581 | $333,559 | $87,490 | $246,069 |
| 2020 | $4,607 | $330,139 | $86,593 | $243,546 |
| 2019 | $4,472 | $323,667 | $84,896 | $238,771 |
| 2018 | $4,189 | $317,322 | $83,232 | $234,090 |
| 2017 | $4,006 | $311,100 | $81,600 | $229,500 |
| 2016 | $1,822 | $156,033 | $36,407 | $119,626 |
| 2015 | $1,799 | $153,691 | $35,861 | $117,830 |
| 2014 | $1,774 | $150,681 | $35,159 | $115,522 |
Source: Public Records
Map
Nearby Homes
- 137 Hastings Ave
- 203 Baylor Dr Unit 11
- 444 Corcoran Ave Unit 4
- 151 Marquette Ave
- 141 Dartmouth Ave
- 121 Forsythia Ct
- 343 B W Williams Dr
- 106 Fieldstone Way
- 0 Antioch Dr
- 408 Lakeside Dr
- 116 Encerti Ave
- 475 Whitney Ave
- 1537 Mini Dr
- 240 Rinaldo Dr
- 150 Granite Ct
- 120 Persimmon Dr
- 144 Hogan Ave
- 116 Bret Harte Way
- 316 Meadows Dr
- 35 Marla Dr
- 207 Stanford Dr
- 219 Stanford Dr
- 219 Cortland Cir
- 213 Cortland Cir
- 201 Stanford Dr
- 225 Stanford Dr
- 207 Cortland Cir
- 231 Cortland Cir
- 159 Stanford Dr
- 231 Stanford Dr
- 201 Cortland Cir
- 237 Cortland Cir
- 153 Stanford Dr
- 237 Stanford Dr
- 218 Cortland Cir
- 212 Cortland Cir
- 224 Cortland Cir
- 243 Cortland Cir
- 163 Cortland Cir
Your Personal Tour Guide
Ask me questions while you tour the home.