Estimated Value: $366,367
--
Bed
--
Bath
723
Sq Ft
$507/Sq Ft
Est. Value
About This Home
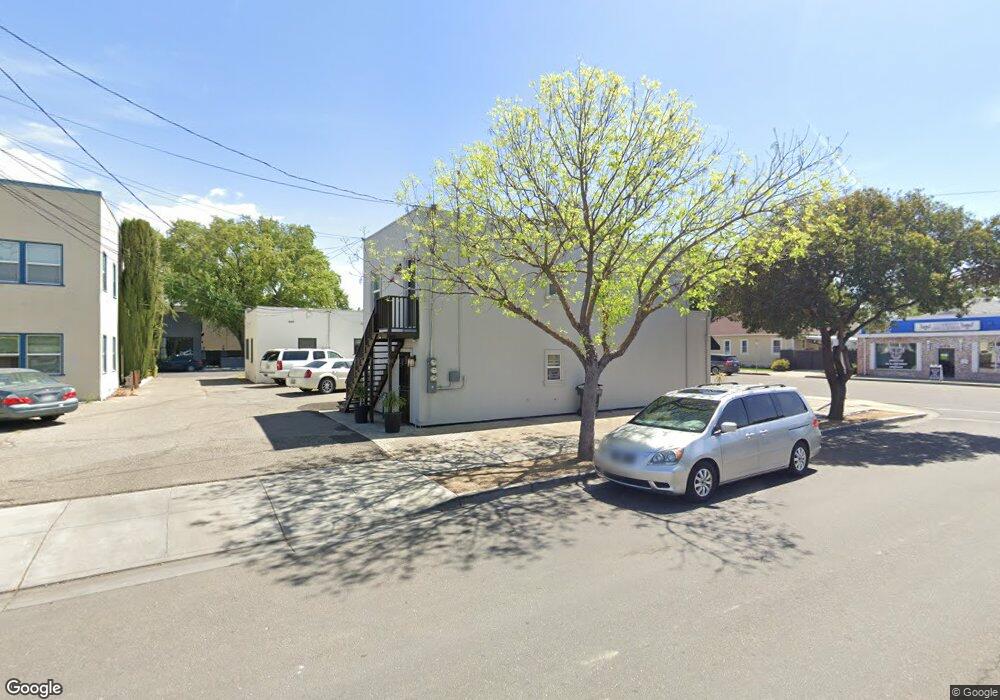
This home is located at 211 W 10th St, Tracy, CA 95376 and is currently estimated at $366,367, approximately $506 per square foot. 211 W 10th St is a home located in San Joaquin County with nearby schools including South/West Park Elementary School, Monte Vista Middle School, and Tracy High School.
Ownership History
Date
Name
Owned For
Owner Type
Purchase Details
Closed on
Oct 2, 2018
Sold by
Jordan Janice K and The Janice Jordan Trust
Bought by
Magat Wilson
Current Estimated Value
Home Financials for this Owner
Home Financials are based on the most recent Mortgage that was taken out on this home.
Original Mortgage
$198,750
Outstanding Balance
$185,211
Interest Rate
8.5%
Mortgage Type
Adjustable Rate Mortgage/ARM
Estimated Equity
$181,156
Purchase Details
Closed on
Nov 1, 2017
Sold by
Jordan Janice Kathleen
Bought by
Jordan Janice K and The Janice Jordan Trust
Purchase Details
Closed on
Mar 14, 2017
Sold by
Jordan Willoughby T and Unified Credit Trust
Bought by
Jordan Janice Kathleen
Purchase Details
Closed on
Jun 29, 2016
Sold by
Jordan Mildred N and The Willoughby T & Mildred N J
Bought by
Trust B The Unified Credit Trust
Create a Home Valuation Report for This Property
The Home Valuation Report is an in-depth analysis detailing your home's value as well as a comparison with similar homes in the area
Home Values in the Area
Average Home Value in this Area
Purchase History
| Date | Buyer | Sale Price | Title Company |
|---|---|---|---|
| Magat Wilson | $265,000 | Fidelity National Title Com | |
| Magat Wilson | -- | Fidelity National Title Comp | |
| Jordan Janice K | -- | None Available | |
| Jordan Janice Kathleen | -- | None Available | |
| Trust B The Unified Credit Trust | -- | None Available |
Source: Public Records
Mortgage History
| Date | Status | Borrower | Loan Amount |
|---|---|---|---|
| Open | Magat Wilson | $198,750 |
Source: Public Records
Tax History Compared to Growth
Tax History
| Year | Tax Paid | Tax Assessment Tax Assessment Total Assessment is a certain percentage of the fair market value that is determined by local assessors to be the total taxable value of land and additions on the property. | Land | Improvement |
|---|---|---|---|---|
| 2025 | $4,205 | $295,606 | $36,809 | $258,797 |
| 2024 | $3,144 | $289,811 | $36,088 | $253,723 |
| 2023 | $3,095 | $284,130 | $35,381 | $248,749 |
| 2022 | $3,033 | $278,560 | $34,688 | $243,872 |
| 2021 | $2,998 | $273,099 | $34,008 | $239,091 |
| 2020 | $2,978 | $270,300 | $33,660 | $236,640 |
| 2019 | $2,931 | $265,000 | $33,000 | $232,000 |
| 2018 | $418 | $36,410 | $4,373 | $32,037 |
| 2017 | $398 | $35,697 | $4,288 | $31,409 |
| 2016 | $402 | $34,997 | $4,204 | $30,793 |
| 2015 | $398 | $34,471 | $4,141 | $30,330 |
| 2014 | $378 | $33,795 | $4,059 | $29,736 |
Source: Public Records
Map
Nearby Homes
- 1241 Parker Ave Unit 1
- 1212 Walnut St
- 1228 Bessie Ave
- 18 W 8th St
- 517 Rockingham Way
- 205 W Beverly Place
- 1561 Bessie Ave
- 835 W Beverly Place
- 262 W Lowell Ave
- 242 W Lowell Ave
- 228 W Lowell Ave
- 610 Tennis Ln
- 1436 Chester Dr
- 213 W South St
- 500 Chestnut Ave
- 331 Chukar Ct
- 1427 Audrey Dr
- 1600 Valerie Ln
- 16 Pereira Ave
- 430 Czerny St