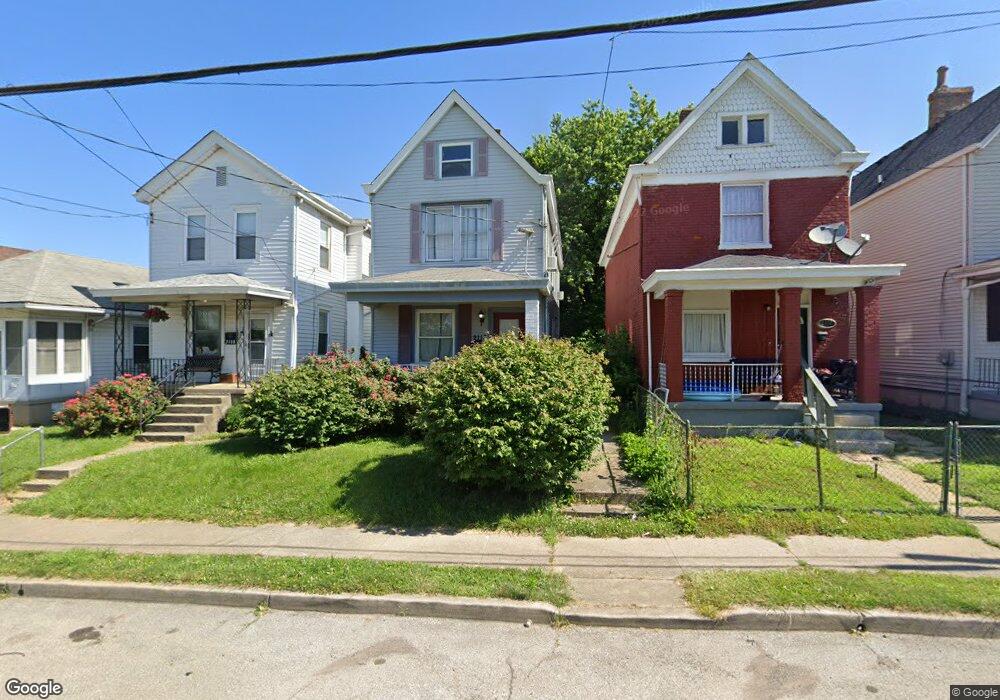
2110 Ross Ave Cincinnati, OH 45212
Estimated Value: $49,000 - $174,000
3
Beds
2
Baths
1,536
Sq Ft
$69/Sq Ft
Est. Value
About This Home
This home is located at 2110 Ross Ave, Cincinnati, OH 45212 and is currently estimated at $106,667, approximately $69 per square foot. 2110 Ross Ave is a home located in Hamilton County with nearby schools including Norwood High School, Cornerstone Christian Academy, and Immaculate Conception Academy.
Ownership History
Date
Name
Owned For
Owner Type
Purchase Details
Closed on
Sep 9, 2025
Sold by
Harrison David L
Bought by
Hernandez Miguel Angel and Martinez Jony Williams
Current Estimated Value
Purchase Details
Closed on
Aug 15, 2025
Sold by
Harrison David L
Bought by
Hermandez Miguel Angel and Martinez Jony Williams
Purchase Details
Closed on
Mar 8, 2013
Sold by
Harrison David L and Harrison Kathy L
Bought by
Harrison David L
Purchase Details
Closed on
Jan 21, 2003
Sold by
Charter One Credit Corp
Bought by
Harrison David L and Harrison Kathy L
Home Financials for this Owner
Home Financials are based on the most recent Mortgage that was taken out on this home.
Original Mortgage
$47,200
Interest Rate
4.87%
Purchase Details
Closed on
Nov 20, 2002
Sold by
Marcella Clay
Bought by
Charter One Credit Corp
Purchase Details
Closed on
Sep 15, 1995
Sold by
Tunstall Larry R and Tunstall Violet
Bought by
Clay Marcella
Home Financials for this Owner
Home Financials are based on the most recent Mortgage that was taken out on this home.
Original Mortgage
$50,000
Interest Rate
7.81%
Create a Home Valuation Report for This Property
The Home Valuation Report is an in-depth analysis detailing your home's value as well as a comparison with similar homes in the area
Home Values in the Area
Average Home Value in this Area
Purchase History
| Date | Buyer | Sale Price | Title Company |
|---|---|---|---|
| Hernandez Miguel Angel | -- | None Listed On Document | |
| Hermandez Miguel Angel | $50,000 | None Listed On Document | |
| Harrison David L | -- | Attorney | |
| Harrison David L | $58,100 | Precision Land Title Agency | |
| Charter One Credit Corp | $66,000 | -- | |
| Clay Marcella | -- | -- |
Source: Public Records
Mortgage History
| Date | Status | Borrower | Loan Amount |
|---|---|---|---|
| Previous Owner | Harrison David L | $47,200 | |
| Previous Owner | Clay Marcella | $50,000 |
Source: Public Records
Tax History
| Year | Tax Paid | Tax Assessment Tax Assessment Total Assessment is a certain percentage of the fair market value that is determined by local assessors to be the total taxable value of land and additions on the property. | Land | Improvement |
|---|---|---|---|---|
| 2025 | $2,331 | $43,691 | $7,259 | $36,432 |
| 2024 | $2,332 | $43,691 | $7,259 | $36,432 |
| 2023 | $2,344 | $43,691 | $7,259 | $36,432 |
| 2022 | $1,447 | $22,663 | $5,499 | $17,164 |
| 2021 | $1,430 | $22,663 | $5,499 | $17,164 |
| 2020 | $1,398 | $22,663 | $5,499 | $17,164 |
| 2019 | $1,335 | $19,880 | $4,823 | $15,057 |
| 2018 | $1,336 | $19,880 | $4,823 | $15,057 |
| 2017 | $1,280 | $19,880 | $4,823 | $15,057 |
| 2016 | $1,551 | $23,059 | $4,148 | $18,911 |
| 2015 | $1,369 | $23,059 | $4,148 | $18,911 |
| 2014 | $1,365 | $23,059 | $4,148 | $18,911 |
| 2013 | $1,569 | $26,810 | $4,823 | $21,987 |
Source: Public Records
Map
Nearby Homes
- 5126 Globe Ave
- 5123 Globe Ave
- 2134 Ross Ave
- 2106 Lawn Ave
- 5121 Rolston Ave
- 5229 Globe Ave
- 5203 Rolston Ave
- 5234 Hunter Ave
- 5258 Hunter Ave
- 2323 Sherwood Ln
- 1945 Lawn Ave
- 5310 Globe Ave
- 5033 Wesley Ave
- 2229 Feldman Ave
- 5206 Montgomery Rd
- 5044 Wesley Ave
- 5314 Section Ave
- 2150 Drex Ave
- 2119 Cathedral Ave
- 4923 Marion Ave
Your Personal Tour Guide
Ask me questions while you tour the home.