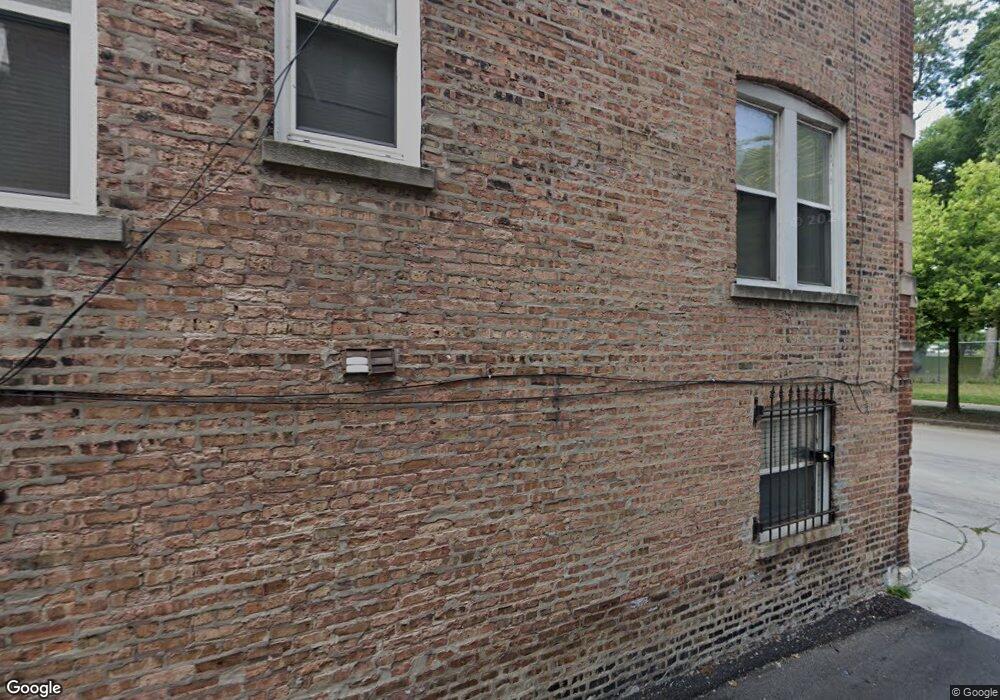
2111 E 67th St Unit 2111G2 Chicago, IL 60649
South Shore NeighborhoodEstimated Value: $59,968 - $81,000
2
Beds
--
Bath
--
Sq Ft
0.42
Acres
About This Home
This home is located at 2111 E 67th St Unit 2111G2, Chicago, IL 60649 and is currently estimated at $70,989. 2111 E 67th St Unit 2111G2 is a home located in Cook County with nearby schools including Okeeffe Elementary School, Hyde Park Academy High School, and St Philip Neri Elementary School.
Ownership History
Date
Name
Owned For
Owner Type
Purchase Details
Closed on
Jun 15, 2023
Sold by
First National Acquisitions Ll
Bought by
Gel Properties Llc
Current Estimated Value
Purchase Details
Closed on
Sep 1, 2006
Sold by
Sylkatis David M
Bought by
Taylor Bruce R
Home Financials for this Owner
Home Financials are based on the most recent Mortgage that was taken out on this home.
Original Mortgage
$25,800
Interest Rate
6.7%
Mortgage Type
Stand Alone Second
Purchase Details
Closed on
Jun 15, 2005
Sold by
Christine Louis Corp
Bought by
Sylkatis David
Home Financials for this Owner
Home Financials are based on the most recent Mortgage that was taken out on this home.
Original Mortgage
$23,100
Interest Rate
5.75%
Mortgage Type
Stand Alone Second
Create a Home Valuation Report for This Property
The Home Valuation Report is an in-depth analysis detailing your home's value as well as a comparison with similar homes in the area
Home Values in the Area
Average Home Value in this Area
Purchase History
| Date | Buyer | Sale Price | Title Company |
|---|---|---|---|
| Gel Properties Llc | $40,000 | None Listed On Document | |
| Taylor Bruce R | $129,000 | Cti | |
| Sylkatis David | $115,500 | 1St American Title |
Source: Public Records
Mortgage History
| Date | Status | Borrower | Loan Amount |
|---|---|---|---|
| Previous Owner | Taylor Bruce R | $25,800 | |
| Previous Owner | Taylor Bruce R | $103,200 | |
| Previous Owner | Sylkatis David | $23,100 | |
| Previous Owner | Sylkatis David | $92,400 |
Source: Public Records
Tax History Compared to Growth
Tax History
| Year | Tax Paid | Tax Assessment Tax Assessment Total Assessment is a certain percentage of the fair market value that is determined by local assessors to be the total taxable value of land and additions on the property. | Land | Improvement |
|---|---|---|---|---|
| 2024 | -- | $4,856 | $457 | $4,399 |
| 2023 | -- | $2,850 | $367 | $2,483 |
| 2022 | $0 | $2,850 | $367 | $2,483 |
| 2021 | $475 | $2,999 | $366 | $2,633 |
| 2020 | $475 | $5,233 | $368 | $4,865 |
| 2019 | $625 | $6,542 | $368 | $6,174 |
| 2018 | $937 | $8,177 | $368 | $7,809 |
| 2017 | $946 | $7,769 | $324 | $7,445 |
| 2016 | $1,056 | $7,769 | $324 | $7,445 |
| 2015 | $943 | $7,769 | $324 | $7,445 |
| 2014 | $796 | $6,861 | $265 | $6,596 |
| 2013 | $770 | $6,861 | $265 | $6,596 |
Source: Public Records
Map
Nearby Homes
- 6752 S Clyde Ave Unit 3
- 6736 S Merrill Ave Unit 4N
- 6721 S Merrill Ave Unit 1
- 6727 S Merrill Ave Unit 3
- 2213 E 68th St Unit 1E
- 2221 E 68th St Unit 3
- 6758 S Jeffery Blvd
- 6843 S Chappel Ave
- 2052 E 69th St Unit 1B
- 6836 S Crandon Ave Unit 3
- 6909 S Chappel Ave
- 6740 S Oglesby Ave Unit 2
- 2334 E 68th St Unit B
- 6756 S Oglesby Ave Unit 1
- 6911 S Jeffery Blvd
- 6922 S Jeffery Blvd Unit 3S
- 6922 S Jeffery Blvd Unit 5N
- 6700 S South Shore Dr Unit 25K
- 6700 S South Shore Dr Unit 21E
- 6700 S South Shore Dr Unit 24C
- 2111 E 67th St Unit 302
- 2111 E 67th St Unit 2111302
- 2111 E 67th St Unit 2111301
- 2111 E 67th St Unit 2111202
- 2111 E 67th St Unit 2111201
- 2111 E 67th St Unit 2111102
- 2111 E 67th St Unit 2111101
- 2111 E 67th St Unit 2111G1
- 2111 E 67th St Unit G2
- 2111 E 67th St Unit G1
- 2111 E 67th St Unit 301
- 2111 E 67th St Unit 201
- 2111 E 67th St Unit 102
- 2107 E 67th St Unit 206
- 2107 E 67th St Unit G4
- 2107 E 67th St Unit 2107203
- 2107 E 67th St Unit 2107204
- 2107 E 67th St Unit 2107G3
- 2107 E 67th St Unit 2107304
- 2107 E 67th St Unit 2107104