Estimated Value: $340,209 - $369,000
3
Beds
2
Baths
1,400
Sq Ft
$253/Sq Ft
Est. Value
About This Home
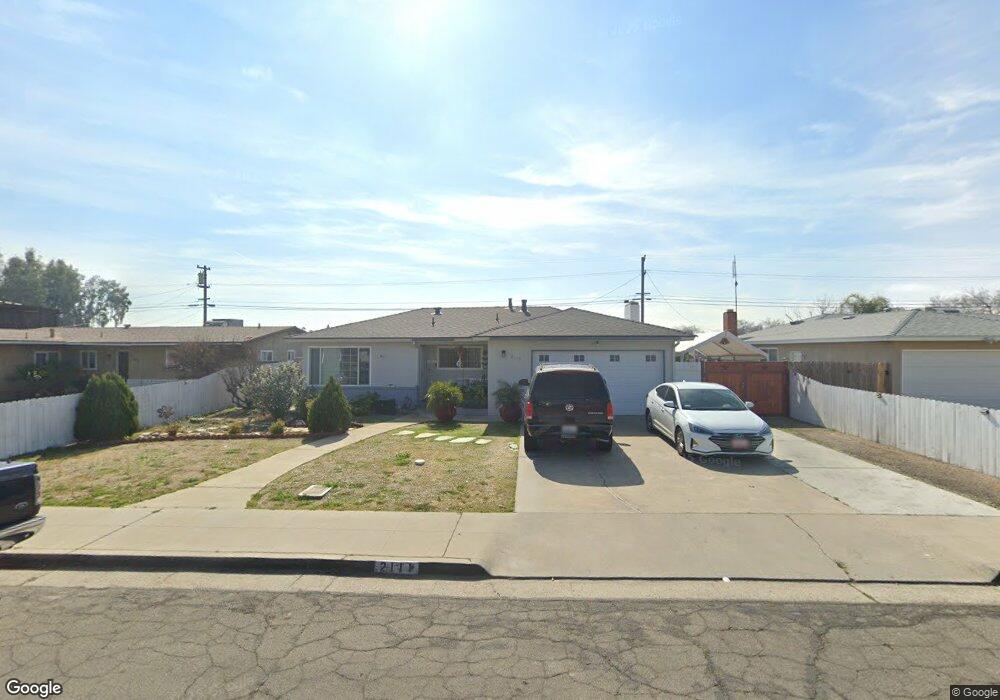
This home is located at 2111 Hillcrest St, Selma, CA 93662 and is currently estimated at $354,802, approximately $253 per square foot. 2111 Hillcrest St is a home located in Fresno County with nearby schools including Andrew Jackson Elementary School, Abraham Lincoln Middle School, and Selma High School.
Ownership History
Date
Name
Owned For
Owner Type
Purchase Details
Closed on
Jun 12, 2018
Sold by
Machnik Joseph Luke and Machnik Tara Leigh
Bought by
Gutierrez Juan M Patino and Gutierrez Jesus Patino
Current Estimated Value
Home Financials for this Owner
Home Financials are based on the most recent Mortgage that was taken out on this home.
Original Mortgage
$226,324
Outstanding Balance
$196,258
Interest Rate
4.62%
Mortgage Type
FHA
Estimated Equity
$158,544
Purchase Details
Closed on
Aug 3, 2011
Sold by
City Of Selma
Bought by
Luke Machnik Joseph and Leigh Tara
Purchase Details
Closed on
Aug 2, 2004
Sold by
Rodriguez Mary G and Rodriguez Donald W
Bought by
Machnik Joseph Luke and Machnik Tara Leigh
Home Financials for this Owner
Home Financials are based on the most recent Mortgage that was taken out on this home.
Original Mortgage
$178,386
Interest Rate
6.17%
Mortgage Type
FHA
Create a Home Valuation Report for This Property
The Home Valuation Report is an in-depth analysis detailing your home's value as well as a comparison with similar homes in the area
Home Values in the Area
Average Home Value in this Area
Purchase History
| Date | Buyer | Sale Price | Title Company |
|---|---|---|---|
| Gutierrez Juan M Patino | $230,500 | Chicago Title Company | |
| Luke Machnik Joseph | -- | None Available | |
| Machnik Joseph Luke | -- | Chicago Title Co | |
| Rodriguez Donald W | -- | Chicago Title Co | |
| Bonnee Yvonne L | -- | Chicago Title Co |
Source: Public Records
Mortgage History
| Date | Status | Borrower | Loan Amount |
|---|---|---|---|
| Open | Gutierrez Juan M Patino | $226,324 | |
| Previous Owner | Machnik Joseph Luke | $178,386 | |
| Closed | Machnik Joseph Luke | $5,550 |
Source: Public Records
Tax History Compared to Growth
Tax History
| Year | Tax Paid | Tax Assessment Tax Assessment Total Assessment is a certain percentage of the fair market value that is determined by local assessors to be the total taxable value of land and additions on the property. | Land | Improvement |
|---|---|---|---|---|
| 2025 | $3,915 | $262,264 | $56,889 | $205,375 |
| 2023 | $3,465 | $252,082 | $54,681 | $197,401 |
| 2022 | $3,696 | $247,140 | $53,609 | $193,531 |
| 2021 | $3,609 | $242,295 | $52,558 | $189,737 |
| 2020 | $3,576 | $239,812 | $52,020 | $187,792 |
| 2019 | $3,486 | $235,110 | $51,000 | $184,110 |
| 2018 | $2,981 | $193,800 | $51,000 | $142,800 |
| 2017 | $2,893 | $190,000 | $50,000 | $140,000 |
| 2016 | $2,441 | $170,000 | $50,000 | $120,000 |
| 2015 | $2,173 | $140,000 | $40,000 | $100,000 |
| 2014 | $2,149 | $140,600 | $24,300 | $116,300 |
Source: Public Records
Map
Nearby Homes
- 3320 Logan St
- 3535 Gaynor St
- 2345 Tammy Ln
- 3280 Mccall Ave
- 1701 Dinuba Ave Unit 216
- 1701 Dinuba Ave Unit 55
- 3714 Jasper St
- 2527 Hicks St
- 3222 Love St
- 2606 Hillcrest St
- 1434 Barbara St
- 3938 Kelly Cir
- 2615 Nelson Blvd
- 3062 Jasper St
- 2577 Lewis St
- 2705 Hicks St
- 3431 Oryan St
- 1304 Aspen St
- 1528 Floral Ave
- 2842 B St
- 2103 Hillcrest St
- 2121 Hillcrest St
- 2131 Hillcrest St
- 3602 Allan St
- 2106 Hillcrest St
- 2045 Hillcrest St
- 2137 Hillcrest St
- 2054 Hillcrest St
- 3607 Allan St
- 2039 Hillcrest St
- 2048 Hillcrest St
- 2145 Hillcrest St
- 3624 Allan St
- 2103 Northhill St
- 2036 Hillcrest St
- 2031 Hillcrest St
- 2053 Northhill St
- 2146 Hillcrest St
- 2153 Hillcrest St
- 3625 Allan St