Estimated Value: $618,000 - $720,000
4
Beds
3
Baths
2,100
Sq Ft
$327/Sq Ft
Est. Value
About This Home
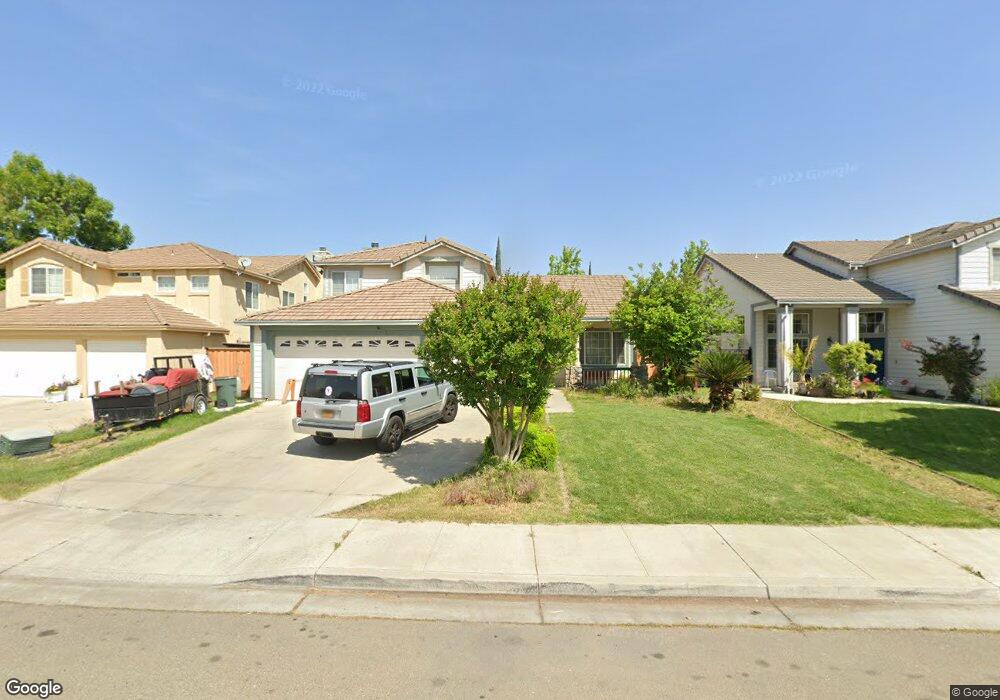
This home is located at 2111 Iroula Way, Tracy, CA 95377 and is currently estimated at $686,189, approximately $326 per square foot. 2111 Iroula Way is a home located in San Joaquin County with nearby schools including Art Freiler, Merrill F. West High School, and Tracy Independent Study Charter School.
Ownership History
Date
Name
Owned For
Owner Type
Purchase Details
Closed on
Apr 6, 2012
Sold by
Morris Jim R and Morris Adelia
Bought by
Morris James R and Morris Adelia R
Current Estimated Value
Purchase Details
Closed on
Jul 26, 2002
Sold by
Morris Jim R
Bought by
Morris Jim R and Morris Adelia
Purchase Details
Closed on
Mar 19, 1997
Sold by
Tri Star Homes Llc
Bought by
Morris Jim R
Home Financials for this Owner
Home Financials are based on the most recent Mortgage that was taken out on this home.
Original Mortgage
$165,550
Outstanding Balance
$20,075
Interest Rate
7.74%
Estimated Equity
$666,114
Purchase Details
Closed on
Jun 18, 1996
Sold by
Tri Star Homes Llc
Bought by
Malsam Laurie A
Home Financials for this Owner
Home Financials are based on the most recent Mortgage that was taken out on this home.
Original Mortgage
$178,100
Interest Rate
8.25%
Create a Home Valuation Report for This Property
The Home Valuation Report is an in-depth analysis detailing your home's value as well as a comparison with similar homes in the area
Home Values in the Area
Average Home Value in this Area
Purchase History
| Date | Buyer | Sale Price | Title Company |
|---|---|---|---|
| Morris James R | -- | None Available | |
| Morris Jim R | -- | Fidelity National Title Ins | |
| Morris Jim R | $207,000 | Old Republic Title Company | |
| Malsam Laurie A | $223,000 | Old Republic Title Company |
Source: Public Records
Mortgage History
| Date | Status | Borrower | Loan Amount |
|---|---|---|---|
| Open | Morris Jim R | $165,550 | |
| Previous Owner | Malsam Laurie A | $178,100 |
Source: Public Records
Tax History Compared to Growth
Tax History
| Year | Tax Paid | Tax Assessment Tax Assessment Total Assessment is a certain percentage of the fair market value that is determined by local assessors to be the total taxable value of land and additions on the property. | Land | Improvement |
|---|---|---|---|---|
| 2025 | $4,226 | $352,121 | $81,426 | $270,695 |
| 2024 | $3,902 | $345,218 | $79,830 | $265,388 |
| 2023 | $3,839 | $338,450 | $78,265 | $260,185 |
| 2022 | $3,760 | $331,815 | $76,731 | $255,084 |
| 2021 | $3,714 | $325,310 | $75,227 | $250,083 |
| 2020 | $3,688 | $321,975 | $74,456 | $247,519 |
| 2019 | $4,014 | $315,663 | $72,997 | $242,666 |
| 2018 | $4,279 | $309,474 | $71,566 | $237,908 |
| 2017 | $4,049 | $303,407 | $70,163 | $233,244 |
| 2016 | $4,097 | $297,460 | $68,788 | $228,672 |
| 2014 | $3,871 | $287,254 | $66,428 | $220,826 |
Source: Public Records
Map
Nearby Homes
- 2090 Iroula Way
- 2121 Iroula Way
- 1586 Arrigotti Ln
- 1762 Ashtree Ct
- 2518 Peppercorn Ln
- 1403 Promenade Cir
- 1533 Vinewood Way
- 2001 Bridle Creek Cir
- 2449 Gaines Ln
- 1422 Greenwillow Way
- 1830 Laurelgrove Ln
- 1150 Palomar Ct
- 1677 Green Springs Ct
- 1750 Laurelgrove Ln
- 8300 W 11th St
- 2610 Meadow Brook Ln
- 1827 Paradise Valley Ct
- 2688 W Byron Rd
- 1600 Valerie Ln
- 1427 Audrey Dr
- 2101 Iroula Way
- 2091 Iroula Way
- 2110 Iroula Way
- 2100 Iroula Way
- 2081 Iroula Way
- 2120 Holder Ln
- 2110 Holder Ln
- 2130 Holder Ln
- 2100 Holder Ln
- 2080 Iroula Way
- 2071 Iroula Way
- 2113 Betty Ln
- 2140 Holder Ln
- 2090 Holder Ln
- 2103 Betty Ln
- 2093 Betty Ln
- 2070 Iroula Way
- 2080 Holder Ln
- 2150 Holder Ln
- 2083 Betty Ln