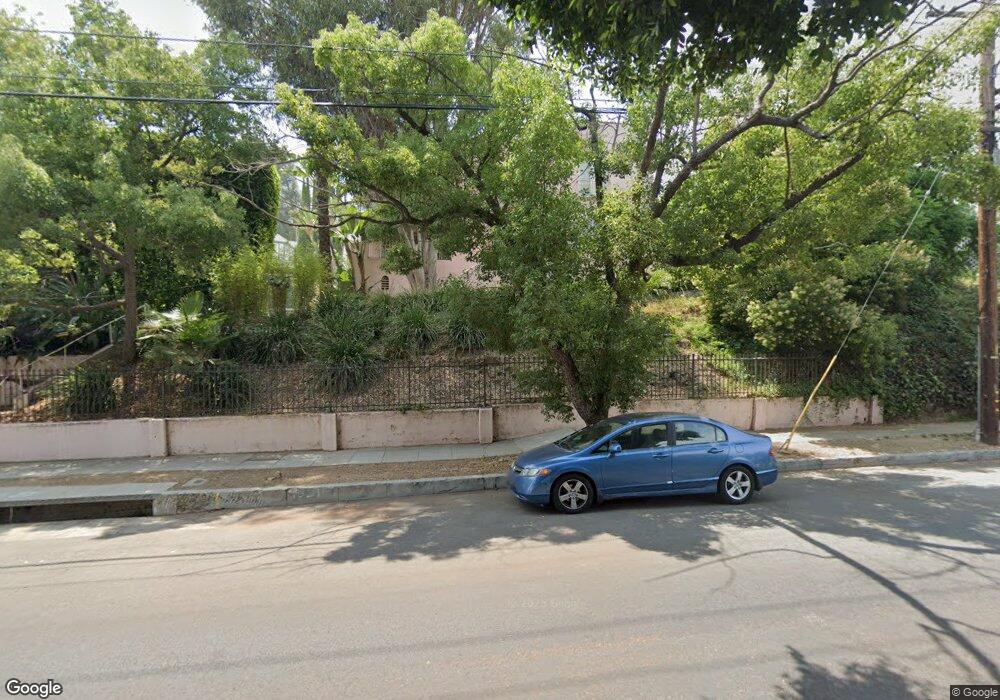
2111 N Bronson Ave Los Angeles, CA 90068
Hollywood Hills NeighborhoodEstimated Value: $2,780,417 - $3,517,000
4
Beds
4
Baths
3,228
Sq Ft
$943/Sq Ft
Est. Value
About This Home
This home is located at 2111 N Bronson Ave, Los Angeles, CA 90068 and is currently estimated at $3,043,854, approximately $942 per square foot. 2111 N Bronson Ave is a home located in Los Angeles County with nearby schools including Cheremoya Avenue Elementary School, Joseph Le Conte Middle School, and Hollywood Senior High School.
Ownership History
Date
Name
Owned For
Owner Type
Purchase Details
Closed on
Oct 18, 1996
Sold by
Garreaud Patrick
Bought by
Ferrin Ingrid M
Current Estimated Value
Home Financials for this Owner
Home Financials are based on the most recent Mortgage that was taken out on this home.
Original Mortgage
$340,000
Outstanding Balance
$31,134
Interest Rate
8.06%
Estimated Equity
$3,012,720
Purchase Details
Closed on
Jun 8, 1994
Sold by
Beresford Bruce
Bought by
Garreaud Patrick and Garreaud Ann
Home Financials for this Owner
Home Financials are based on the most recent Mortgage that was taken out on this home.
Original Mortgage
$391,000
Interest Rate
8.6%
Purchase Details
Closed on
Feb 16, 1994
Sold by
Duigan Virginia
Bought by
Beresford Bruce
Create a Home Valuation Report for This Property
The Home Valuation Report is an in-depth analysis detailing your home's value as well as a comparison with similar homes in the area
Home Values in the Area
Average Home Value in this Area
Purchase History
| Date | Buyer | Sale Price | Title Company |
|---|---|---|---|
| Ferrin Ingrid M | $425,000 | Progressive Title Company | |
| Garreaud Patrick | $460,000 | Equity Title Company | |
| Beresford Bruce | -- | Equity Title Company |
Source: Public Records
Mortgage History
| Date | Status | Borrower | Loan Amount |
|---|---|---|---|
| Open | Ferrin Ingrid M | $340,000 | |
| Previous Owner | Garreaud Patrick | $391,000 | |
| Closed | Ferrin Ingrid M | $42,500 |
Source: Public Records
Tax History Compared to Growth
Tax History
| Year | Tax Paid | Tax Assessment Tax Assessment Total Assessment is a certain percentage of the fair market value that is determined by local assessors to be the total taxable value of land and additions on the property. | Land | Improvement |
|---|---|---|---|---|
| 2025 | $8,671 | $692,170 | $566,776 | $125,394 |
| 2024 | $8,671 | $678,599 | $555,663 | $122,936 |
| 2023 | $8,510 | $665,294 | $544,768 | $120,526 |
| 2022 | $8,148 | $652,250 | $534,087 | $118,163 |
| 2021 | $8,037 | $639,462 | $523,615 | $115,847 |
| 2019 | $7,735 | $620,497 | $508,085 | $112,412 |
| 2018 | $7,636 | $608,331 | $498,123 | $110,208 |
| 2016 | $7,242 | $584,711 | $478,781 | $105,930 |
| 2015 | $7,138 | $575,929 | $471,590 | $104,339 |
| 2014 | $7,167 | $564,649 | $462,353 | $102,296 |
Source: Public Records
Map
Nearby Homes
- 2027 Canyon Dr
- 5920 Chula Vista Way Unit 2
- 1957 N Bronson Ave Unit 112
- 1966 N Van Ness Ave
- 5751 Valley Oak Dr
- 2222 N Beachwood Dr Unit 211
- 2222 N Beachwood Dr Unit 207
- 2130 N Beachwood Dr
- 0 Cheremoya Ave
- 5912 Canyon Cove
- 5940 Manola Way
- 2293 Bronson Hill Dr
- 2011 N Beachwood Dr
- 2464 Hollyridge Dr
- 5692 Holly Oak Dr
- 5924 Graciosa Dr
- 6002 Graciosa Dr
- 6040 Graciosa Dr
- 1926 N Wilton Place
- 2311 Alto Oak Dr
- 2101 N Bronson Ave
- 2121 N Bronson Ave
- 5917 Foothill Dr
- 2215 Hollyridge Dr
- 2145 Hollyridge Loop
- 2127 N Bronson Ave
- 2108 N Bronson Ave
- 2145 Hollyridge Dr
- 2114 N Bronson Ave
- 2102 N Bronson Ave
- 2019 N Bronson Ave
- 2120 N Bronson Ave
- 5914 Foothill Dr
- 2126 N Bronson Ave
- 2026 N Bronson Ave
- 2015 N Bronson Ave
- 2155 Hollyridge Loop
- 5920 Foothill Dr
- 2211 Hollyridge Dr
- 2004 N Bronson Ave