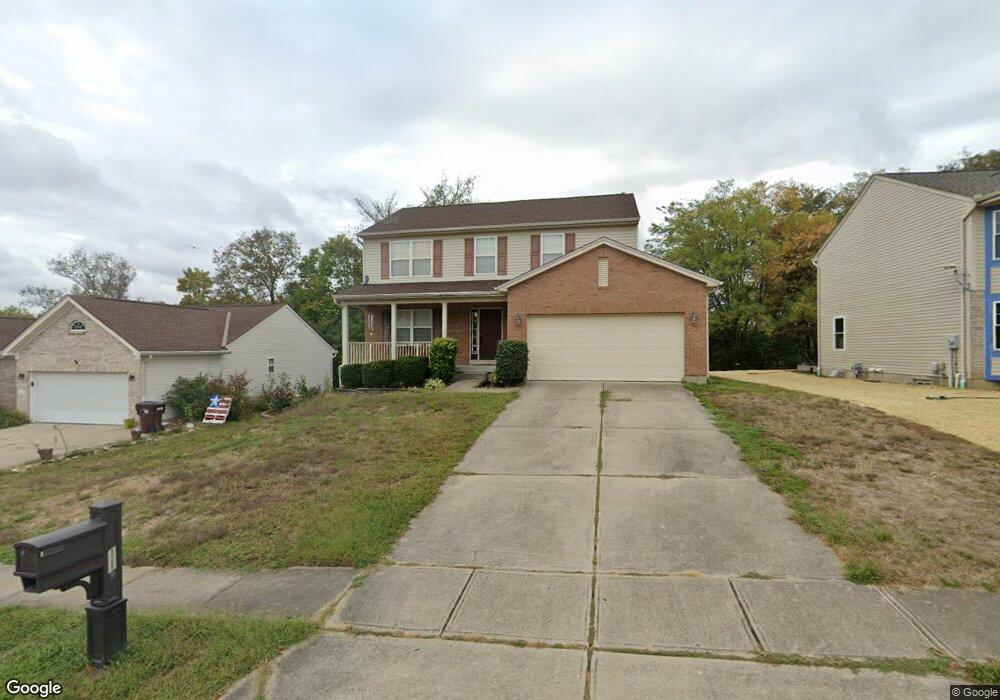
2111 Starlight Ln Unit 184 Independence, KY 41051
Estimated Value: $342,000 - $363,000
4
Beds
3
Baths
2,056
Sq Ft
$172/Sq Ft
Est. Value
About This Home
This home is located at 2111 Starlight Ln Unit 184, Independence, KY 41051 and is currently estimated at $353,658, approximately $172 per square foot. 2111 Starlight Ln Unit 184 is a home located in Kenton County with nearby schools including Simon Kenton High School, St. Cecilia Catholic School, and Calvary Christian School.
Ownership History
Date
Name
Owned For
Owner Type
Purchase Details
Closed on
Sep 9, 2014
Sold by
Hardin Shannon and Hardin Kristy
Bought by
Hardin Kristy and Shields Kristy
Current Estimated Value
Purchase Details
Closed on
Oct 26, 2006
Sold by
Montgomery Ruben D Darrell and Montgomery Mekesha H
Bought by
Hardin Shannon and Hardin Kristy
Home Financials for this Owner
Home Financials are based on the most recent Mortgage that was taken out on this home.
Original Mortgage
$203,500
Outstanding Balance
$142,145
Interest Rate
9.7%
Mortgage Type
Stand Alone First
Estimated Equity
$211,513
Purchase Details
Closed on
Feb 6, 2004
Sold by
The Ryland Group Inc
Bought by
Montgomery Ruben D Darrell and Montgomery Mekesha H
Home Financials for this Owner
Home Financials are based on the most recent Mortgage that was taken out on this home.
Original Mortgage
$136,600
Interest Rate
5.77%
Mortgage Type
Balloon
Purchase Details
Closed on
Feb 5, 2003
Sold by
Finke Homes Inc
Bought by
Ryland Group Inc
Create a Home Valuation Report for This Property
The Home Valuation Report is an in-depth analysis detailing your home's value as well as a comparison with similar homes in the area
Home Values in the Area
Average Home Value in this Area
Purchase History
| Date | Buyer | Sale Price | Title Company |
|---|---|---|---|
| Hardin Kristy | -- | None Available | |
| Hardin Shannon | $203,500 | None Available | |
| Montgomery Ruben D Darrell | $182,185 | -- | |
| Ryland Group Inc | $605,000 | -- |
Source: Public Records
Mortgage History
| Date | Status | Borrower | Loan Amount |
|---|---|---|---|
| Open | Hardin Shannon | $203,500 | |
| Previous Owner | Montgomery Ruben D Darrell | $136,600 |
Source: Public Records
Tax History Compared to Growth
Tax History
| Year | Tax Paid | Tax Assessment Tax Assessment Total Assessment is a certain percentage of the fair market value that is determined by local assessors to be the total taxable value of land and additions on the property. | Land | Improvement |
|---|---|---|---|---|
| 2024 | $2,929 | $239,100 | $35,000 | $204,100 |
| 2023 | $3,017 | $239,100 | $35,000 | $204,100 |
| 2022 | $3,074 | $239,100 | $35,000 | $204,100 |
| 2021 | $3,120 | $239,100 | $35,000 | $204,100 |
| 2020 | $2,723 | $203,500 | $30,000 | $173,500 |
| 2019 | $2,730 | $203,500 | $30,000 | $173,500 |
| 2018 | $2,745 | $203,500 | $30,000 | $173,500 |
| 2017 | $2,669 | $203,500 | $30,000 | $173,500 |
| 2015 | $2,594 | $203,500 | $31,800 | $171,700 |
| 2014 | $2,558 | $203,500 | $31,800 | $171,700 |
Source: Public Records
Map
Nearby Homes
- 4910 Fowler Creek Rd
- 4879 Open Meadow Dr
- 2215 Scheper Ct
- 4758 Fowler Creek Rd
- 10448 Canberra Dr
- 10447 Canberra Dr
- 3952 Piperidge Way
- 64 Sylvan Dr
- 114 Sylvan Dr
- 3850 Sherbourne Dr
- 1365 Cairns Ct
- 5118 Dana Harvey Ln
- 3852 Sherbourne Dr
- 143 Tando Way
- 7 Waterside Way
- 1479 Rising Ridge Dr
- 6212 Streamside Dr
- QUENTIN Plan at Sherbourne - Sherbourne Summits
- SHELBURN Plan at Sherbourne - Sherbourne Summits
- 36 Crystal Lake Dr
- 2111 Starlight Ln
- 2107 Starlight Ln
- 2121 Starlight Ln
- 4974 Moonlight Way
- 4970 Moonlight Way
- 2110 Starlight Ln
- 2106 Starlight Ln
- 2122 Starlight Ln
- 2122 Starlight Ln Unit 193
- 2131 Starlight Ln
- 4964 Moonlight Way
- 4978 Moonlight Way
- 2126 Starlight Ln
- 2126 Starlight Ln Unit 192
- 2130 Starlight Ln
- 4960 Moonlight Way
- 2114 Starlight Ln
- 2114 Starlight Ln Unit 195
- 2137 Starlight Ln
- 2118 Starlight Ln