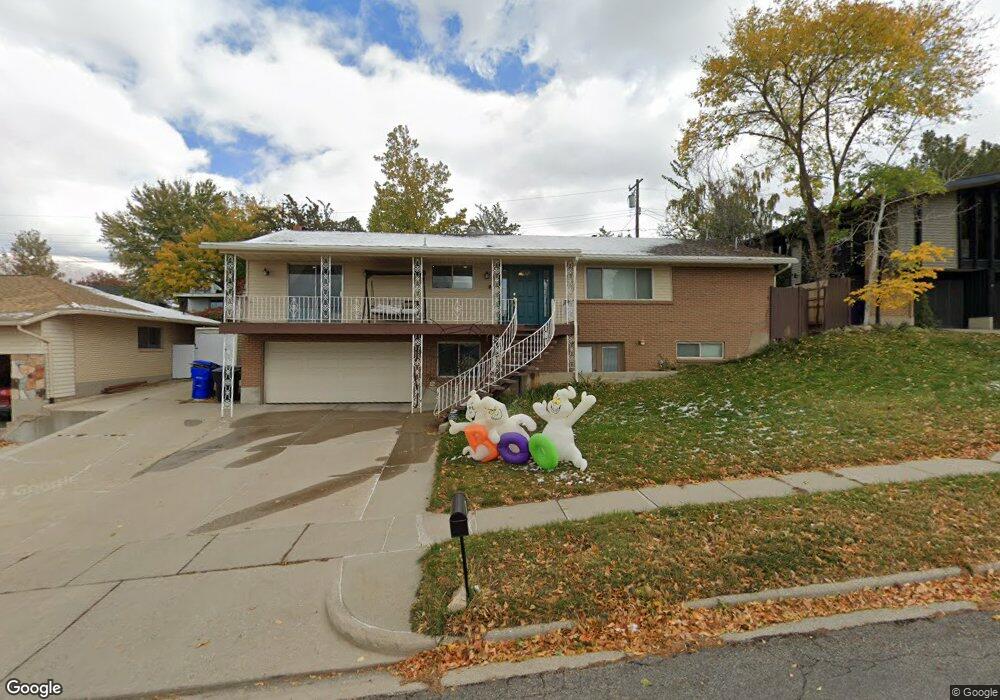
2113 Claremont Dr Bountiful, UT 84010
Estimated Value: $602,000 - $696,000
5
Beds
3
Baths
3,200
Sq Ft
$206/Sq Ft
Est. Value
About This Home
This home is located at 2113 Claremont Dr, Bountiful, UT 84010 and is currently estimated at $658,444, approximately $205 per square foot. 2113 Claremont Dr is a home located in Davis County with nearby schools including Muir School, Mueller Park Junior High School, and Bountiful High School.
Ownership History
Date
Name
Owned For
Owner Type
Purchase Details
Closed on
Dec 21, 2020
Sold by
Parkin Spencer and Parkin Mary
Bought by
Parkin Spencer Taylor and Parkin Mary Melinda
Current Estimated Value
Home Financials for this Owner
Home Financials are based on the most recent Mortgage that was taken out on this home.
Original Mortgage
$171,500
Outstanding Balance
$124,491
Interest Rate
2.7%
Mortgage Type
New Conventional
Estimated Equity
$533,953
Purchase Details
Closed on
Sep 21, 2011
Sold by
Porter Brett L and Porter Paige P
Bought by
Parkin Spencer T and Parkin Mary M
Home Financials for this Owner
Home Financials are based on the most recent Mortgage that was taken out on this home.
Original Mortgage
$220,000
Interest Rate
4.26%
Mortgage Type
New Conventional
Purchase Details
Closed on
May 16, 2001
Sold by
Bratke John E and Bratke Annette G
Bought by
Porter Brett L and Porter Paige P
Home Financials for this Owner
Home Financials are based on the most recent Mortgage that was taken out on this home.
Original Mortgage
$173,000
Interest Rate
7.03%
Create a Home Valuation Report for This Property
The Home Valuation Report is an in-depth analysis detailing your home's value as well as a comparison with similar homes in the area
Purchase History
| Date | Buyer | Sale Price | Title Company |
|---|---|---|---|
| Parkin Spencer Taylor | -- | Us Title Company Of Utah | |
| Parkin Spencer T | -- | North American Titl | |
| Porter Brett L | -- | Backman Stewart Title Servic |
Source: Public Records
Mortgage History
| Date | Status | Borrower | Loan Amount |
|---|---|---|---|
| Open | Parkin Spencer Taylor | $171,500 | |
| Closed | Parkin Spencer T | $220,000 | |
| Previous Owner | Porter Brett L | $173,000 |
Source: Public Records
Tax History
| Year | Tax Paid | Tax Assessment Tax Assessment Total Assessment is a certain percentage of the fair market value that is determined by local assessors to be the total taxable value of land and additions on the property. | Land | Improvement |
|---|---|---|---|---|
| 2025 | $3,594 | $333,300 | $118,517 | $214,783 |
| 2024 | $3,357 | $321,750 | $109,495 | $212,255 |
| 2023 | $3,251 | $565,000 | $195,631 | $369,369 |
| 2022 | $3,247 | $309,100 | $103,771 | $205,329 |
| 2021 | $2,940 | $428,000 | $153,989 | $274,011 |
| 2020 | $2,606 | $381,000 | $140,279 | $240,721 |
| 2019 | $2,652 | $379,000 | $144,713 | $234,287 |
| 2018 | $2,439 | $343,000 | $133,525 | $209,475 |
| 2016 | $2,125 | $161,865 | $40,039 | $121,826 |
| 2015 | $2,092 | $150,535 | $40,039 | $110,496 |
| 2014 | $2,000 | $147,637 | $40,039 | $107,598 |
| 2013 | -- | $134,883 | $39,322 | $95,561 |
Source: Public Records
Map
Nearby Homes
- 2136 Elaine Dr
- 1087 Arlington Way
- 842 E 2150 S
- 1997 S 800 E
- 0 Bountiful Blvd
- 771 E 1825 S
- 626 E 2150 S
- 1475 Mueller Park Rd
- 1785 1450 E Unit 604
- 1987 Mapleview Dr
- 631 E 1700 S
- 1820 S High Pointe Dr
- 1886 S Jeri Dr
- 795 Abby Ln Unit 5
- 1735 S Temple Ct Unit 203
- 1596 E Millbrook Way
- 438 E 1800 S
- 2059 S 350 E Unit 6
- 2046 S 350 E Unit 4
- 2038 S 350 E Unit 3
- 2141 Claremont Dr
- 2085 Claremont Dr
- 2110 S 1125 E
- 2070 S 1125 E
- 2106 Claremont Dr
- 2134 Claremont Dr
- 2130 S 1125 E
- 1088 Deborah Dr
- 2080 Claremont Dr
- 2171 Claremont Dr
- 2052 S 1125 E
- 2160 Claremont Dr
- 2148 S 1125 E
- 2052 Claremont Dr
- 2125 Elaine Dr
- 2095 Elaine Dr
- 2145 Elaine Dr
- 2174 Claremont Dr
- 2071 S 1125 E
- 2129 S 1125 E
Your Personal Tour Guide
Ask me questions while you tour the home.