2113 W 89th St Minneapolis, MN 55431
West Bloomington NeighborhoodEstimated Value: $398,000 - $413,000
3
Beds
2
Baths
2,276
Sq Ft
$178/Sq Ft
Est. Value
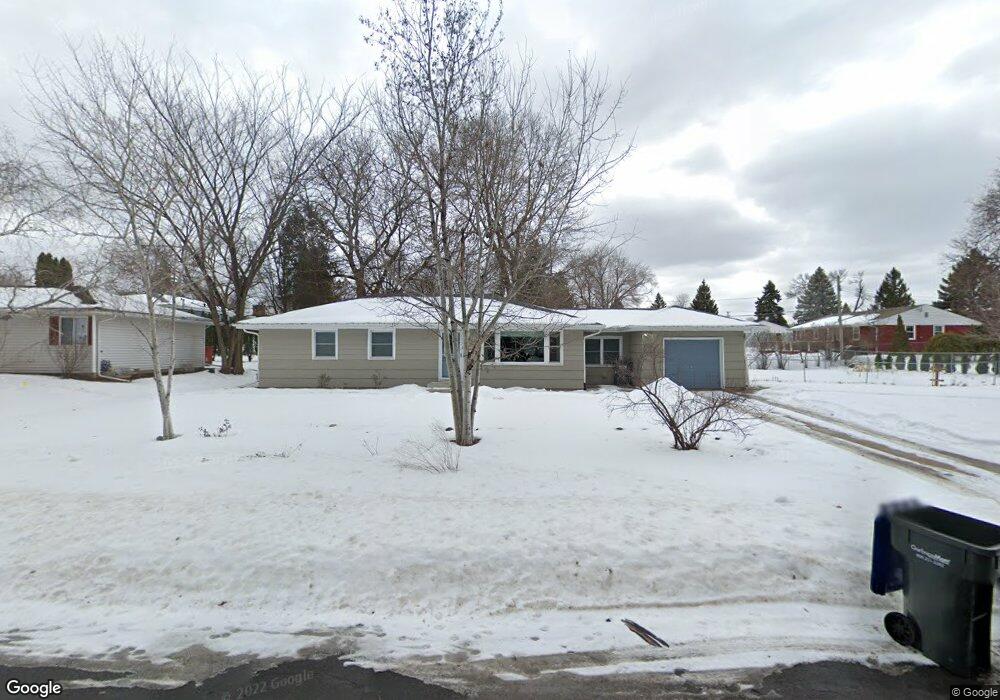
About This Home
This home is located at 2113 W 89th St, Minneapolis, MN 55431 and is currently estimated at $405,336, approximately $178 per square foot. 2113 W 89th St is a home located in Hennepin County with nearby schools including Washburn Elementary School, Valley View Middle School, and Kennedy Senior High School.
Ownership History
Date
Name
Owned For
Owner Type
Purchase Details
Closed on
Sep 8, 2020
Sold by
Webber Stephanie Mae and Webber Samson Joseph
Bought by
Excell Braxton M and Excell Kellie D
Current Estimated Value
Home Financials for this Owner
Home Financials are based on the most recent Mortgage that was taken out on this home.
Original Mortgage
$316,350
Outstanding Balance
$280,740
Interest Rate
2.9%
Mortgage Type
New Conventional
Estimated Equity
$124,596
Purchase Details
Closed on
Jun 25, 2009
Sold by
Bank Of New York Mellon
Bought by
Chastek Stephenie M and Webber Gallick Samson J
Purchase Details
Closed on
Sep 15, 2004
Sold by
Kariampuzha Charles and Kariampuzha Lekha
Bought by
Mctamaney Patrick
Purchase Details
Closed on
Dec 26, 1996
Sold by
Wietstock Lana M
Bought by
Kariampuzha Charles W and Kariampuzha Lakha C
Create a Home Valuation Report for This Property
The Home Valuation Report is an in-depth analysis detailing your home's value as well as a comparison with similar homes in the area
Home Values in the Area
Average Home Value in this Area
Purchase History
| Date | Buyer | Sale Price | Title Company |
|---|---|---|---|
| Excell Braxton M | $333,000 | Results Title | |
| Chastek Stephenie M | $140,000 | -- | |
| Mctamaney Patrick | $220,000 | -- | |
| Kariampuzha Charles W | $114,900 | -- |
Source: Public Records
Mortgage History
| Date | Status | Borrower | Loan Amount |
|---|---|---|---|
| Open | Excell Braxton M | $316,350 |
Source: Public Records
Tax History Compared to Growth
Tax History
| Year | Tax Paid | Tax Assessment Tax Assessment Total Assessment is a certain percentage of the fair market value that is determined by local assessors to be the total taxable value of land and additions on the property. | Land | Improvement |
|---|---|---|---|---|
| 2024 | $4,931 | $389,000 | $147,300 | $241,700 |
| 2023 | $4,503 | $376,200 | $134,500 | $241,700 |
| 2022 | $4,086 | $371,300 | $134,500 | $236,800 |
| 2021 | $3,046 | $324,900 | $130,900 | $194,000 |
| 2020 | $3,130 | $251,800 | $127,200 | $124,600 |
| 2019 | $2,897 | $251,400 | $127,200 | $124,200 |
| 2018 | $2,805 | $230,900 | $126,000 | $104,900 |
| 2017 | $2,542 | $202,800 | $113,100 | $89,700 |
| 2016 | $2,504 | $191,300 | $107,000 | $84,300 |
| 2015 | $2,528 | $186,400 | $103,800 | $82,600 |
| 2014 | -- | $165,800 | $100,700 | $65,100 |
Source: Public Records
Map
Nearby Homes
- 2101 W 89th St
- 8831 Queen Ave S
- 8836 James Ave S
- 9149 Queen Ave S
- 8545 Penn Ave S
- 8549 Russell Ave S
- 1706 W 86th St
- 8525 Penn Ave S
- 2300 W 95th St
- 8706 Aldrich Ave S
- 9609 Vincent Ave S
- 8212 Fremont Ave S Unit D
- 8264 York Ave S
- 8114 Emerson Ave S
- 8117 Xerxes Cir
- 1114 W 80th 1 2 St
- 8256 Beard Rd
- 8140 Abbott Ave S
- 9020 Blaisdell Ave S
- 3216 W 81st St
- 2119 W 89th St
- 8919 Newton Ave S
- 8906 Morgan Ave S
- 8925 Newton Ave S
- 2112 W 89th St
- 8912 Morgan Ave S
- 2106 W 89th St
- 2118 W 89th St
- 2100 W 89th St
- 8931 Newton Ave S
- 8918 Morgan Ave S
- 2124 W 89th St
- 2025 W 89th St
- 8912 Newton Ave S
- 8906 Newton Ave S
- 8918 Newton Ave S
- 2030 W 89th St
- 8937 Newton Ave S
- 8924 Newton Ave S
- 8907 Morgan Ave S