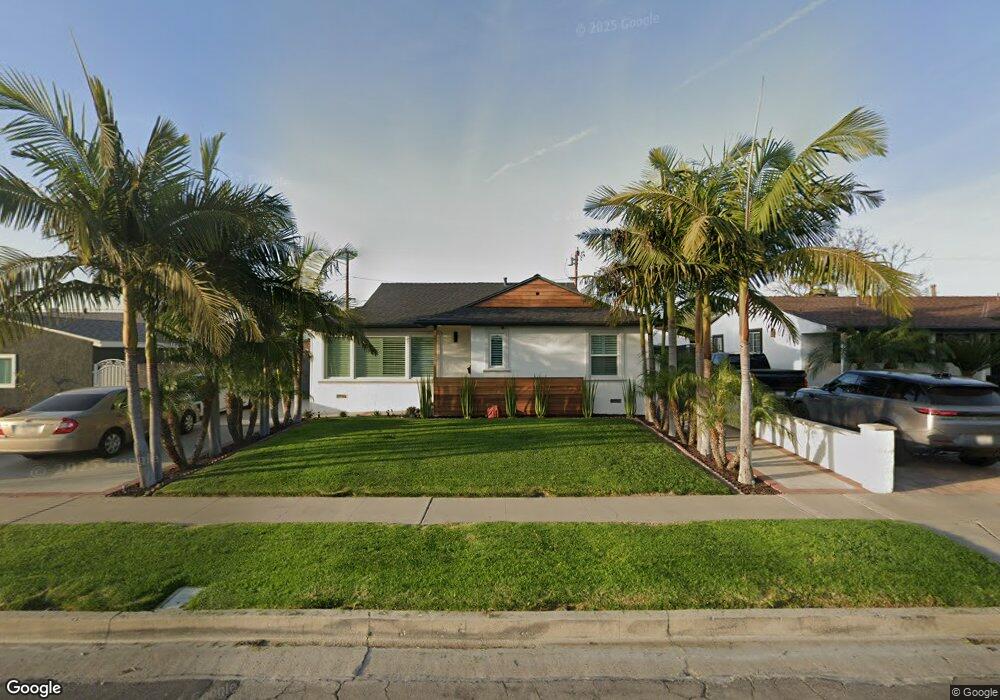
2113 W Cherry Ave Fullerton, CA 92833
Estimated Value: $878,032 - $914,000
3
Beds
2
Baths
1,194
Sq Ft
$753/Sq Ft
Est. Value
About This Home
This home is located at 2113 W Cherry Ave, Fullerton, CA 92833 and is currently estimated at $899,508, approximately $753 per square foot. 2113 W Cherry Ave is a home located in Orange County with nearby schools including Pacific Drive Elementary School, Nicolas Junior High School, and Buena Park High School.
Ownership History
Date
Name
Owned For
Owner Type
Purchase Details
Closed on
May 22, 2015
Sold by
Huisken Heath E
Bought by
Huisken Heath E and Heath E Huisken Revocable Trust
Current Estimated Value
Purchase Details
Closed on
Jul 10, 2011
Sold by
Reyes Gerardo C
Bought by
Huisken Heath E
Home Financials for this Owner
Home Financials are based on the most recent Mortgage that was taken out on this home.
Original Mortgage
$331,381
Outstanding Balance
$230,546
Interest Rate
4.75%
Mortgage Type
FHA
Estimated Equity
$668,962
Purchase Details
Closed on
Nov 12, 2004
Sold by
Reyes Cynthia Ann
Bought by
Reyes Gerardo C
Home Financials for this Owner
Home Financials are based on the most recent Mortgage that was taken out on this home.
Original Mortgage
$360,000
Interest Rate
5.12%
Mortgage Type
New Conventional
Purchase Details
Closed on
Oct 19, 2004
Sold by
Lindsay Stalcup Barbara J and Lindsay Barbara J
Bought by
Reyes Gerardo C
Home Financials for this Owner
Home Financials are based on the most recent Mortgage that was taken out on this home.
Original Mortgage
$360,000
Interest Rate
5.12%
Mortgage Type
New Conventional
Create a Home Valuation Report for This Property
The Home Valuation Report is an in-depth analysis detailing your home's value as well as a comparison with similar homes in the area
Purchase History
| Date | Buyer | Sale Price | Title Company |
|---|---|---|---|
| Huisken Heath E | -- | None Available | |
| Huisken Heath E | $340,000 | Western Resources Title | |
| Reyes Gerardo C | -- | Old Republic Title | |
| Reyes Gerardo C | $450,000 | Old Republic Title |
Source: Public Records
Mortgage History
| Date | Status | Borrower | Loan Amount |
|---|---|---|---|
| Open | Huisken Heath E | $331,381 | |
| Previous Owner | Reyes Gerardo C | $360,000 | |
| Closed | Reyes Gerardo C | $67,500 |
Source: Public Records
Tax History
| Year | Tax Paid | Tax Assessment Tax Assessment Total Assessment is a certain percentage of the fair market value that is determined by local assessors to be the total taxable value of land and additions on the property. | Land | Improvement |
|---|---|---|---|---|
| 2025 | $4,783 | $427,053 | $359,347 | $67,706 |
| 2024 | $4,783 | $418,680 | $352,301 | $66,379 |
| 2023 | $4,666 | $410,471 | $345,393 | $65,078 |
| 2022 | $4,631 | $402,423 | $338,621 | $63,802 |
| 2021 | $4,550 | $394,533 | $331,982 | $62,551 |
| 2020 | $4,524 | $390,488 | $328,578 | $61,910 |
| 2019 | $4,408 | $382,832 | $322,135 | $60,697 |
| 2018 | $4,416 | $375,326 | $315,819 | $59,507 |
| 2017 | $4,343 | $367,967 | $309,626 | $58,341 |
| 2016 | $4,254 | $360,752 | $303,554 | $57,198 |
| 2015 | $4,137 | $355,334 | $298,995 | $56,339 |
| 2014 | -- | $348,374 | $293,138 | $55,236 |
Source: Public Records
Map
Nearby Homes
- 801 S Courtney Ave
- 2009 W Oak Ave
- 2100 W Valencia Dr
- 2380 W Orangethorpe Ave Unit 14
- 1850 W Orangethorpe Ave
- 1850 W Orangethorpe Ave Unit 24
- 1850 W Orangethorpe Ave Unit 44
- 1422 Peckham St Unit A
- 2321 Williamson Ave
- 3604 W Valencia Dr
- 2540 W Picadilly Way
- 134 S Pritchard Ave
- 8927 Orangethorpe Ave
- 6921 Cottonwood Ln
- 6982 Crimson Dr
- 2210 W Coronet Ave
- 1510 W Orangethorpe Ave
- 1254 N Gilbert St
- 3515 W Commonwealth Ave
- 2057 W Coronet Ave
- 2107 W Cherry Ave
- 2119 W Cherry Ave
- 2112 W Olive Ave
- 2106 W Olive Ave
- 2118 W Olive Ave
- 2101 W Cherry Ave
- 2125 W Cherry Ave
- 2100 W Olive Ave
- 2124 W Olive Ave
- 2112 W Cherry Ave
- 2118 W Cherry Ave
- 2106 W Cherry Ave
- 2043 W Cherry Ave
- 2131 W Cherry Ave
- 2100 W Cherry Ave
- 2124 W Cherry Ave
- 2042 W Olive Ave
- 2130 W Olive Ave
- 2139 W Cherry Ave
- 2039 W Cherry Ave
Your Personal Tour Guide
Ask me questions while you tour the home.