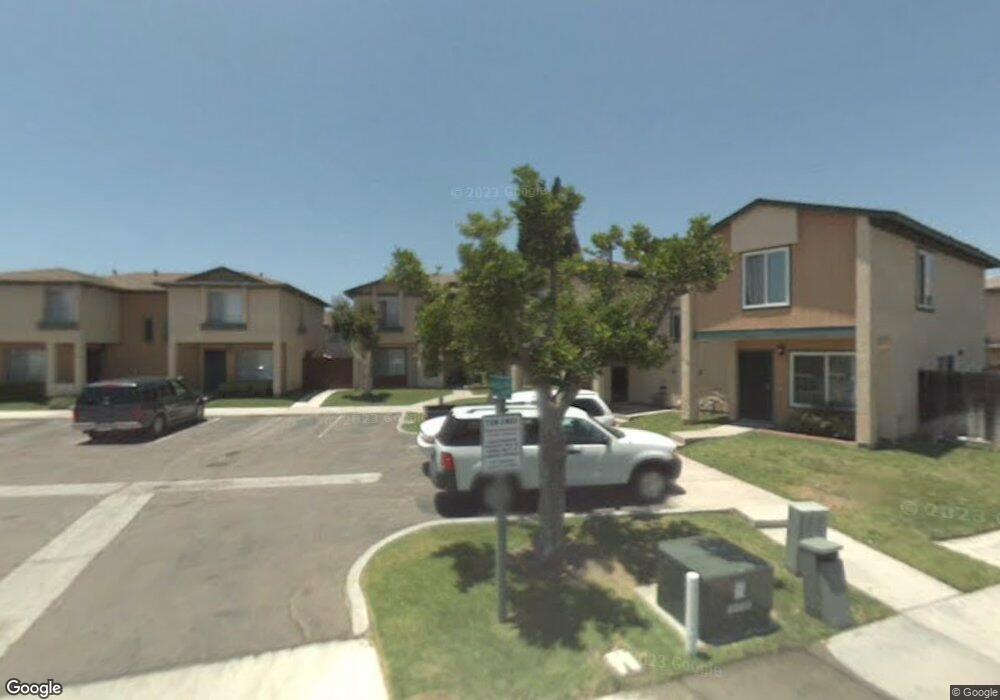
2114 Bluehaven Ct San Diego, CA 92154
Nestor NeighborhoodEstimated Value: $553,000 - $607,000
3
Beds
3
Baths
1,338
Sq Ft
$429/Sq Ft
Est. Value
About This Home
This home is located at 2114 Bluehaven Ct, San Diego, CA 92154 and is currently estimated at $573,465, approximately $428 per square foot. 2114 Bluehaven Ct is a home located in San Diego County with nearby schools including Willow Elementary School, San Ysidro Middle School, and San Ysidro High School.
Ownership History
Date
Name
Owned For
Owner Type
Purchase Details
Closed on
Mar 24, 2010
Sold by
Magbanua Richard G and Magbanua Estelita C
Bought by
Garcia Jose Arana
Current Estimated Value
Home Financials for this Owner
Home Financials are based on the most recent Mortgage that was taken out on this home.
Original Mortgage
$157,102
Interest Rate
5.21%
Mortgage Type
FHA
Purchase Details
Closed on
Aug 30, 2001
Sold by
Sanchez Heriberto S and Sanchez Maria Lourdes
Bought by
Magbanua Richard G and Magbanua Estelita C
Home Financials for this Owner
Home Financials are based on the most recent Mortgage that was taken out on this home.
Original Mortgage
$151,620
Interest Rate
6.91%
Mortgage Type
FHA
Purchase Details
Closed on
Mar 20, 1992
Purchase Details
Closed on
Jul 20, 1984
Create a Home Valuation Report for This Property
The Home Valuation Report is an in-depth analysis detailing your home's value as well as a comparison with similar homes in the area
Home Values in the Area
Average Home Value in this Area
Purchase History
| Date | Buyer | Sale Price | Title Company |
|---|---|---|---|
| Garcia Jose Arana | $160,000 | Settlement One Title | |
| Magbanua Richard G | $154,000 | Benefit Land Title | |
| -- | $106,500 | -- | |
| -- | $63,900 | -- |
Source: Public Records
Mortgage History
| Date | Status | Borrower | Loan Amount |
|---|---|---|---|
| Previous Owner | Garcia Jose Arana | $157,102 | |
| Previous Owner | Magbanua Richard G | $151,620 |
Source: Public Records
Tax History Compared to Growth
Tax History
| Year | Tax Paid | Tax Assessment Tax Assessment Total Assessment is a certain percentage of the fair market value that is determined by local assessors to be the total taxable value of land and additions on the property. | Land | Improvement |
|---|---|---|---|---|
| 2025 | $2,534 | $206,514 | $53,248 | $153,266 |
| 2024 | $2,534 | $202,465 | $52,204 | $150,261 |
| 2023 | $2,485 | $198,496 | $51,181 | $147,315 |
| 2022 | $2,376 | $194,605 | $50,178 | $144,427 |
| 2021 | $2,392 | $190,791 | $49,195 | $141,596 |
| 2020 | $2,356 | $188,836 | $48,691 | $140,145 |
| 2019 | $2,256 | $185,135 | $47,737 | $137,398 |
| 2018 | $2,219 | $181,505 | $46,801 | $134,704 |
| 2017 | $2,187 | $177,947 | $45,884 | $132,063 |
| 2016 | $2,114 | $174,459 | $44,985 | $129,474 |
| 2015 | $2,103 | $171,840 | $44,310 | $127,530 |
| 2014 | $2,074 | $168,475 | $43,443 | $125,032 |
Source: Public Records
Map
Nearby Homes
- 1817 Bluehaven Ct
- 2950 Arbodar Rd
- 879 W San Ysidro Blvd Unit 1
- 2033 Dairy Mart Rd Unit 13
- 875 W San Ysidro Blvd Unit 14
- 1312 W San Ysidro Blvd Unit B
- 3053 Tequila Way
- 1847 Via Encantadoras
- 3584 Sunset Ln Unit 131
- 3550 Sunset Ln Unit 13
- 3566 Sunset Ln Unit 71
- 3572 Sunset Ln Unit 81
- 1756 Via Del Tanido
- 1697 Shooting Star Ct
- 1861 Katella St
- 2950 Iris Ave Unit 52
- 2888 Iris Ave Unit 43
- 2888 Iris Ave
- 2404 Tocayo Ave Unit 140
- 3754 Shooting Star Dr
- 2116 Bluehaven Ct
- 2082 Bluehaven Ct
- 2110 Bluehaven Ct
- 2156 Bluehaven Ct
- 2120 Bluehaven Ct
- 2086 Bluehaven Ct
- 2078 Bluehaven Ct
- 2154 Bluehaven Ct
- 2158 Bluehaven Ct
- 2108 Bluehaven Ct
- 2122 Bluehaven Ct
- 2152 Bluehaven Ct
- 2090 Bluehaven Ct
- 2074 Bluehaven Ct
- 2160 Bluehaven Ct
- 2070 Bluehaven Ct
- 2150 Bluehaven Ct
- 2094 Bluehaven Ct
- 2162 Bluehaven Ct
- 2126 Bluehaven Ct