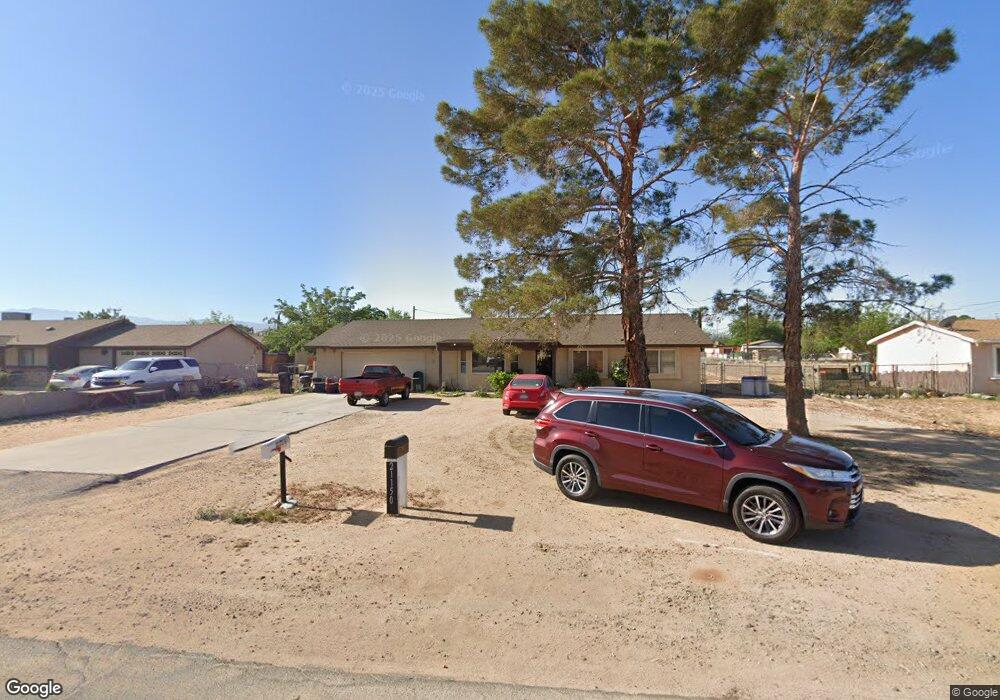
21145 Multnomah Rd Apple Valley, CA 92308
High Desert NeighborhoodEstimated Value: $355,200 - $403,000
3
Beds
2
Baths
1,240
Sq Ft
$302/Sq Ft
Est. Value
About This Home
This home is located at 21145 Multnomah Rd, Apple Valley, CA 92308 and is currently estimated at $374,550, approximately $302 per square foot. 21145 Multnomah Rd is a home located in San Bernardino County with nearby schools including Yucca Loma Elementary School and Apple Valley High School.
Ownership History
Date
Name
Owned For
Owner Type
Purchase Details
Closed on
Oct 5, 2011
Sold by
Nordsiek Anthony
Bought by
Moffett Mari Anne and The Mari Anne Moffett Living T
Current Estimated Value
Purchase Details
Closed on
Sep 7, 2005
Sold by
Port George A
Bought by
Nordsiek Anthony J and Nordsiek Rosie
Home Financials for this Owner
Home Financials are based on the most recent Mortgage that was taken out on this home.
Original Mortgage
$200,000
Interest Rate
5.81%
Mortgage Type
Purchase Money Mortgage
Purchase Details
Closed on
Apr 28, 1997
Sold by
Bush Ila J and Bush Elsie
Bought by
Port Miriam B
Home Financials for this Owner
Home Financials are based on the most recent Mortgage that was taken out on this home.
Original Mortgage
$56,600
Interest Rate
8.13%
Create a Home Valuation Report for This Property
The Home Valuation Report is an in-depth analysis detailing your home's value as well as a comparison with similar homes in the area
Home Values in the Area
Average Home Value in this Area
Purchase History
| Date | Buyer | Sale Price | Title Company |
|---|---|---|---|
| Moffett Mari Anne | -- | Lawyers Title | |
| Nordsiek Anthony J | $251,000 | Fidelity National Title Co | |
| Port Miriam B | $63,000 | Chicago Title Insurance Co |
Source: Public Records
Mortgage History
| Date | Status | Borrower | Loan Amount |
|---|---|---|---|
| Previous Owner | Nordsiek Anthony J | $200,000 | |
| Previous Owner | Port Miriam B | $56,600 |
Source: Public Records
Tax History
| Year | Tax Paid | Tax Assessment Tax Assessment Total Assessment is a certain percentage of the fair market value that is determined by local assessors to be the total taxable value of land and additions on the property. | Land | Improvement |
|---|---|---|---|---|
| 2025 | $1,118 | $85,410 | $25,623 | $59,787 |
| 2024 | $1,088 | $83,736 | $25,121 | $58,615 |
| 2023 | $1,077 | $82,094 | $24,628 | $57,466 |
| 2022 | $1,060 | $80,484 | $24,145 | $56,339 |
| 2021 | $1,036 | $78,906 | $23,672 | $55,234 |
| 2020 | $1,304 | $78,097 | $23,429 | $54,668 |
| 2019 | $1,284 | $76,566 | $22,970 | $53,596 |
| 2018 | $980 | $75,065 | $22,520 | $52,545 |
| 2017 | $966 | $73,593 | $22,078 | $51,515 |
| 2016 | $892 | $72,150 | $21,645 | $50,505 |
| 2015 | $878 | $71,066 | $21,320 | $49,746 |
| 2014 | $866 | $69,674 | $20,902 | $48,772 |
Source: Public Records
Map
Nearby Homes
- 21215 Multnomah Rd
- 21100 Bear Valley Rd
- 21336 Laguna Rd
- 21650 Bear Valley Rd
- 11911 Kiowa Rd
- 11852 Jamacha Rd
- 21110 Sandia Rd
- 12765 Pocomoke Rd
- 20592 Mockingbird Ave
- 11875 Morning Star Rd
- 11724 Jamacha Rd
- 12546 Navajo Rd
- 12744 Running Deer Rd
- 0 Rancho Rd Unit HD26024460
- 21275 Pocomoke Rd
- 12850 Lakota Rd
- 11679 Winterhawk Way
- 0 Matawan Rd
- 20404 Half Moon Ct
- 12785 Morning Star Rd
- 21133 Multnomah Rd
- 21169 Multnomah Rd
- 21179 Multnomah Rd
- 21144 Klamath Rd
- 21152 Klamath Rd
- 21128 Klamath Rd
- 21166 Klamath Rd
- 21187 Multnomah Rd
- 21170 Multnomah Rd
- 21134 Multnomah Rd Unit 3
- 21089 Multnomah Rd
- 21180 Multnomah Rd
- 21180 Klamath Rd
- 21110 Multnomah Rd
- 21110 Klamath Rd
- 21209 Multnomah Rd
- 21150 Multnomah Rd
- 21190 Multnomah Rd
- 21208 Klamath Rd
- 21090 Multnomah Rd Unit 2
Your Personal Tour Guide
Ask me questions while you tour the home.