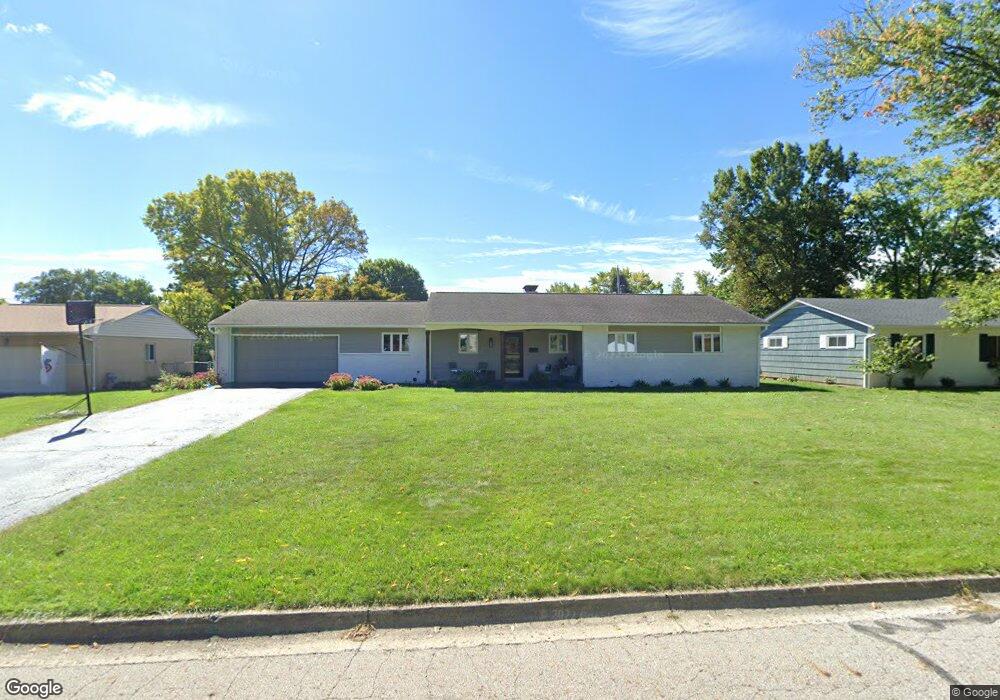
2115 Chardon Rd Columbus, OH 43220
Estimated Value: $561,000 - $649,000
4
Beds
2
Baths
1,840
Sq Ft
$326/Sq Ft
Est. Value
About This Home
This home is located at 2115 Chardon Rd, Columbus, OH 43220 and is currently estimated at $600,648, approximately $326 per square foot. 2115 Chardon Rd is a home located in Franklin County with nearby schools including Windermere Elementary School, Hastings Middle School, and Upper Arlington High School.
Ownership History
Date
Name
Owned For
Owner Type
Purchase Details
Closed on
Dec 3, 2019
Sold by
Jackson Elinor K
Bought by
Henry Todd R and Henry Amy Enochs
Current Estimated Value
Home Financials for this Owner
Home Financials are based on the most recent Mortgage that was taken out on this home.
Original Mortgage
$284,000
Outstanding Balance
$248,217
Interest Rate
3.6%
Mortgage Type
New Conventional
Estimated Equity
$352,431
Purchase Details
Closed on
May 20, 1998
Sold by
Marmitt Gary P and Mckeand Sharon L
Bought by
Jackson Albert H and Jackson Elinor K
Purchase Details
Closed on
Jan 3, 1997
Sold by
Hann Gerald E
Bought by
Mckeand Gary P Marmitt and Mckeand Sharon L
Home Financials for this Owner
Home Financials are based on the most recent Mortgage that was taken out on this home.
Original Mortgage
$156,750
Interest Rate
7%
Mortgage Type
New Conventional
Purchase Details
Closed on
Nov 1, 1983
Create a Home Valuation Report for This Property
The Home Valuation Report is an in-depth analysis detailing your home's value as well as a comparison with similar homes in the area
Home Values in the Area
Average Home Value in this Area
Purchase History
| Date | Buyer | Sale Price | Title Company |
|---|---|---|---|
| Henry Todd R | $355,000 | Transcounty Title | |
| Jackson Albert H | $188,000 | Central City Title Agency | |
| Mckeand Gary P Marmitt | $165,000 | -- | |
| -- | $91,500 | -- |
Source: Public Records
Mortgage History
| Date | Status | Borrower | Loan Amount |
|---|---|---|---|
| Open | Henry Todd R | $284,000 | |
| Previous Owner | Mckeand Gary P Marmitt | $156,750 |
Source: Public Records
Tax History
| Year | Tax Paid | Tax Assessment Tax Assessment Total Assessment is a certain percentage of the fair market value that is determined by local assessors to be the total taxable value of land and additions on the property. | Land | Improvement |
|---|---|---|---|---|
| 2025 | $9,799 | $162,370 | $75,360 | $87,010 |
| 2024 | $9,799 | $162,370 | $75,360 | $87,010 |
| 2023 | $9,683 | $162,370 | $75,360 | $87,010 |
| 2022 | $8,828 | $121,840 | $53,970 | $67,870 |
| 2021 | $7,851 | $121,840 | $53,970 | $67,870 |
| 2020 | $7,865 | $121,840 | $53,970 | $67,870 |
| 2019 | $6,626 | $104,300 | $53,970 | $50,330 |
| 2018 | $6,097 | $104,300 | $53,970 | $50,330 |
| 2017 | $6,093 | $104,300 | $53,970 | $50,330 |
| 2016 | $5,610 | $93,600 | $34,970 | $58,630 |
| 2015 | $5,605 | $93,600 | $34,970 | $58,630 |
| 2014 | $5,612 | $93,600 | $34,970 | $58,630 |
| 2013 | $2,652 | $85,085 | $31,780 | $53,305 |
Source: Public Records
Map
Nearby Homes
- 2200 Nayland Rd
- 2411 Sheringham Rd
- 4370 Harborough Rd
- 2475 Mccoy Rd
- 2533 Middlesex Rd
- 3670 Romnay Rd
- 3949 Norbrook Dr
- 2458 Edgevale Rd
- 2413 Edgevale Rd
- 1605 Lafayette Dr Unit 1605
- 1594 Lafayette Dr Unit 1594
- 2560 Chartwell Rd
- 2480 Shrewsbury Rd
- 2626 Chartwell Rd
- 2443 Shrewsbury Rd
- 2682 Lane Rd
- 2424 Nottingham Rd
- 2177 Oakmount Rd
- 2158 Sandston Rd
- 3950 Riverside Dr
- 2127 Chardon Rd
- 2120 Haviland Rd
- 2132 Haviland Rd
- 2110 Haviland Rd
- 2114 Chardon Rd
- 2137 Chardon Rd
- 2095 Chardon Rd
- 2124 Chardon Rd
- 2104 Chardon Rd
- 2100 Haviland Rd
- 4100 Woodbridge Rd
- 2134 Chardon Rd
- 2092 Chardon Rd
- 2083 Chardon Rd
- 2088 Haviland Rd
- 2125 Haviland Rd
- 2115 Haviland Rd
- 2135 Haviland Rd
- 2121 Mccoy Rd
- 2095 Mccoy Rd
Your Personal Tour Guide
Ask me questions while you tour the home.