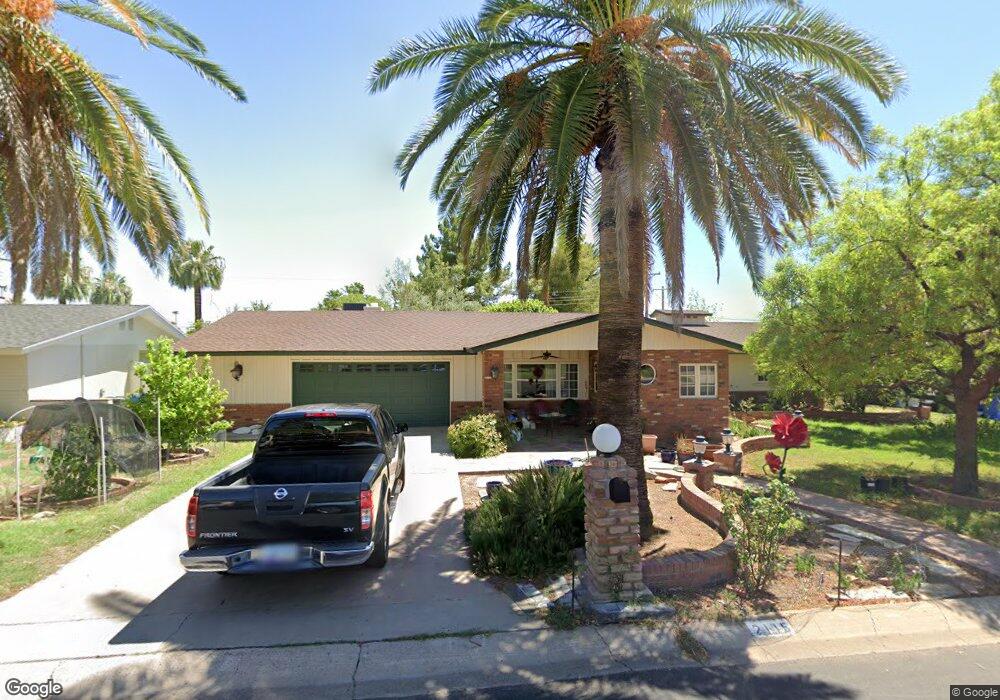
2115 E Montebello Ave Phoenix, AZ 85016
Camelback East Village NeighborhoodEstimated Value: $797,000 - $1,680,000
Studio
2
Baths
2,989
Sq Ft
$419/Sq Ft
Est. Value
About This Home
This home is located at 2115 E Montebello Ave, Phoenix, AZ 85016 and is currently estimated at $1,251,694, approximately $418 per square foot. 2115 E Montebello Ave is a home located in Maricopa County with nearby schools including Madison Rose Lane Elementary School, Madison No. 1 Middle School, and Camelback High School.
Ownership History
Date
Name
Owned For
Owner Type
Purchase Details
Closed on
Oct 11, 2013
Sold by
Groh Gregory E
Bought by
Groh Gregory E and Reed Kathleen D
Current Estimated Value
Purchase Details
Closed on
Aug 4, 2013
Sold by
Groh Gregory E
Bought by
Groh Gregory E and Reed Kathleen D
Purchase Details
Closed on
May 20, 2013
Sold by
Groh Rochelle A
Bought by
Groh Gregory E
Purchase Details
Closed on
Apr 19, 2002
Sold by
Groh Gregory E
Bought by
Groh Gregory E and Reed Kathleen D
Purchase Details
Closed on
Feb 16, 2001
Sold by
Groh Rochelle A
Bought by
Groh Gregory E
Create a Home Valuation Report for This Property
The Home Valuation Report is an in-depth analysis detailing your home's value as well as a comparison with similar homes in the area
Home Values in the Area
Average Home Value in this Area
Purchase History
| Date | Buyer | Sale Price | Title Company |
|---|---|---|---|
| Groh Gregory E | -- | None Available | |
| Groh Gregory E | -- | None Available | |
| Groh Gregory E | -- | None Available | |
| Groh Gregory E | -- | -- | |
| Groh Gregory E | -- | Century Title Agency |
Source: Public Records
Tax History
| Year | Tax Paid | Tax Assessment Tax Assessment Total Assessment is a certain percentage of the fair market value that is determined by local assessors to be the total taxable value of land and additions on the property. | Land | Improvement |
|---|---|---|---|---|
| 2025 | $8,462 | $69,559 | -- | -- |
| 2024 | $7,808 | $66,247 | -- | -- |
| 2023 | $7,808 | $78,450 | $15,690 | $62,760 |
| 2022 | $7,557 | $69,370 | $13,870 | $55,500 |
| 2021 | $7,628 | $64,120 | $12,820 | $51,300 |
| 2020 | $7,500 | $57,730 | $11,540 | $46,190 |
| 2019 | $7,321 | $52,930 | $10,580 | $42,350 |
| 2018 | $7,127 | $51,570 | $10,310 | $41,260 |
| 2017 | $6,763 | $50,300 | $10,060 | $40,240 |
| 2016 | $6,509 | $48,370 | $9,670 | $38,700 |
| 2015 | $6,003 | $48,680 | $9,730 | $38,950 |
Source: Public Records
Map
Nearby Homes
- 2007 E Rancho Dr
- 2141 E Palo Verde Dr
- 2131 E Bethany Home Rd
- 1903 E Palo Verde Dr
- 1901 E Missouri Ave Unit 216
- 1910 E Missouri Ave
- 5516 N 24th St
- 1807 E San Miguel Ave
- 1808 E Luke Ave
- 5301 N 23rd St
- 2421 E Montebello Ave
- 2501 E Montebello Ave
- 2502 E Montebello Ave
- 1930 E Rovey Ave
- 5315 N 18th St Unit 3
- 5236 N 20th St Unit C4
- 2514 E Montebello Ave
- 5628 N 17th St
- 1704 E Solano Dr
- 2521 E Marshall Ave Unit 1
- 2109 E Montebello Ave
- 2123 E Montebello Ave
- 5616 N 21st Place
- 5612 N 21st Place
- 2122 E Montebello Ave
- 2129 E Montebello Ave
- 2101 E Montebello Ave
- 5619 N 21st St
- 2114 E Montebello Ave Unit 2
- 2134 E Montebello Ave
- 5611 N 21st St
- 2106 E Montebello Ave
- 2137 E Montebello Ave
- 5615 N 21st Place
- 2142 E Montebello Ave
- 2114 E San Juan Ave
- 5713 N 21st St
- 2035 E Montebello Ave
- 5620 N 21st St
- 2102 E San Juan Ave
Your Personal Tour Guide
Ask me questions while you tour the home.