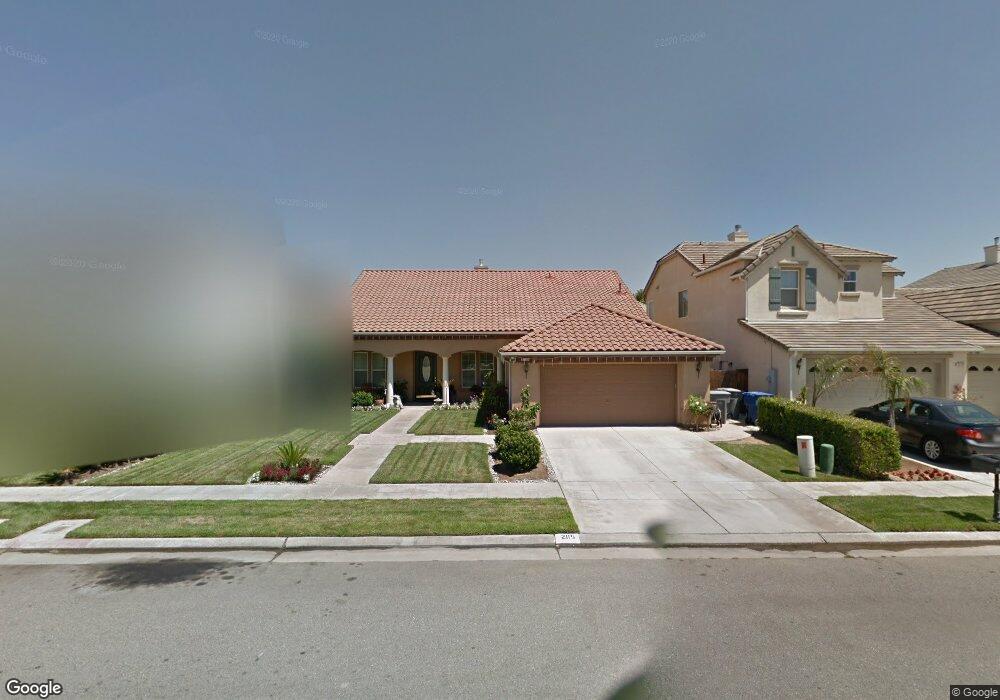
2115 Lester Ave Clovis, CA 93619
Estimated Value: $646,000 - $733,000
5
Beds
3
Baths
2,601
Sq Ft
$267/Sq Ft
Est. Value
About This Home
This home is located at 2115 Lester Ave, Clovis, CA 93619 and is currently estimated at $693,170, approximately $266 per square foot. 2115 Lester Ave is a home located in Fresno County with nearby schools including Dry Creek Elementary School, Alta Sierra Intermediate School, and Buchanan High School.
Ownership History
Date
Name
Owned For
Owner Type
Purchase Details
Closed on
Mar 15, 2013
Sold by
Leyva Aileen
Bought by
Leyva Geo F and Leyva Aileen C
Current Estimated Value
Home Financials for this Owner
Home Financials are based on the most recent Mortgage that was taken out on this home.
Original Mortgage
$273,000
Outstanding Balance
$192,212
Interest Rate
3.49%
Mortgage Type
New Conventional
Estimated Equity
$500,958
Purchase Details
Closed on
Nov 12, 2007
Sold by
Leyva Aileen and Leyva Geo
Bought by
Leyva Geo F and Leyva Aileen C
Purchase Details
Closed on
Feb 6, 2003
Sold by
Clovis Town & Country I Lp
Bought by
Leyva Geo and Leyva Aileen
Home Financials for this Owner
Home Financials are based on the most recent Mortgage that was taken out on this home.
Original Mortgage
$269,908
Interest Rate
5.54%
Create a Home Valuation Report for This Property
The Home Valuation Report is an in-depth analysis detailing your home's value as well as a comparison with similar homes in the area
Home Values in the Area
Average Home Value in this Area
Purchase History
| Date | Buyer | Sale Price | Title Company |
|---|---|---|---|
| Leyva Geo F | -- | Placer Title | |
| Leyva Aileen | -- | Placer Title Company | |
| Leyva Aileen | -- | Placer Title Company | |
| Leyva Geo F | -- | None Available | |
| Leyva Geo | $337,500 | Chicago Title Company |
Source: Public Records
Mortgage History
| Date | Status | Borrower | Loan Amount |
|---|---|---|---|
| Open | Leyva Aileen | $273,000 | |
| Closed | Leyva Aileen | $273,000 | |
| Previous Owner | Leyva Geo | $269,908 | |
| Closed | Leyva Geo | $33,738 |
Source: Public Records
Tax History
| Year | Tax Paid | Tax Assessment Tax Assessment Total Assessment is a certain percentage of the fair market value that is determined by local assessors to be the total taxable value of land and additions on the property. | Land | Improvement |
|---|---|---|---|---|
| 2025 | $6,037 | $488,070 | $94,132 | $393,938 |
| 2023 | $5,793 | $469,120 | $90,478 | $378,642 |
| 2022 | $5,637 | $459,922 | $88,704 | $371,218 |
| 2021 | $5,463 | $450,905 | $86,965 | $363,940 |
| 2020 | $5,477 | $446,283 | $86,074 | $360,209 |
| 2019 | $5,361 | $468,160 | $84,387 | $383,773 |
| 2018 | $5,596 | $458,982 | $82,733 | $376,249 |
| 2017 | $5,497 | $449,983 | $81,111 | $368,872 |
| 2016 | $5,305 | $441,161 | $79,521 | $361,640 |
| 2015 | $5,213 | $434,535 | $78,327 | $356,208 |
| 2014 | $4,909 | $409,600 | $73,700 | $335,900 |
Source: Public Records
Map
Nearby Homes
- 2319 Prescott Ave
- 9226 N Fowler Ave
- 1684 Heirloom Ave
- 5211 E Shepherd Ave
- 1685 Heirloom Ave
- 1675 Heirloom Ave
- 8220 N Fowler Ave
- 1731 N Hanson Ave
- 1655 Heirloom Ave
- 2023 N Wagon Ln
- 2029 N Wagon Ln
- 2035 N Wagon Ln
- 2041 N Wagon Ln
- 2047 N Wagon Ln
- 2053 N Wagon Ln
- 2059 N Wagon Ln
- 2065 N Wagon Ln
- 2071 N Wagon Ln
- 2077 N Wagon Ln
- 2083 N Wagon Ln
- 2125 Lester Ave
- 2095 Lester Ave
- 2112 Everglade Ave
- 2135 Lester Ave
- 2085 Lester Ave
- 2122 Everglade Ave
- 2092 Everglade Ave
- 2132 Everglade Ave
- 2082 Everglade Ave
- 2114 Lester Ave
- 2124 Lester Ave
- 2145 Lester Ave
- 2075 Lester Ave
- 2094 Lester Ave
- 2134 Lester Ave
- 2072 Everglade Ave
- 2142 Everglade Ave
- 2084 Lester Ave
- 2144 Lester Ave
- 2155 Lester Ave
Your Personal Tour Guide
Ask me questions while you tour the home.