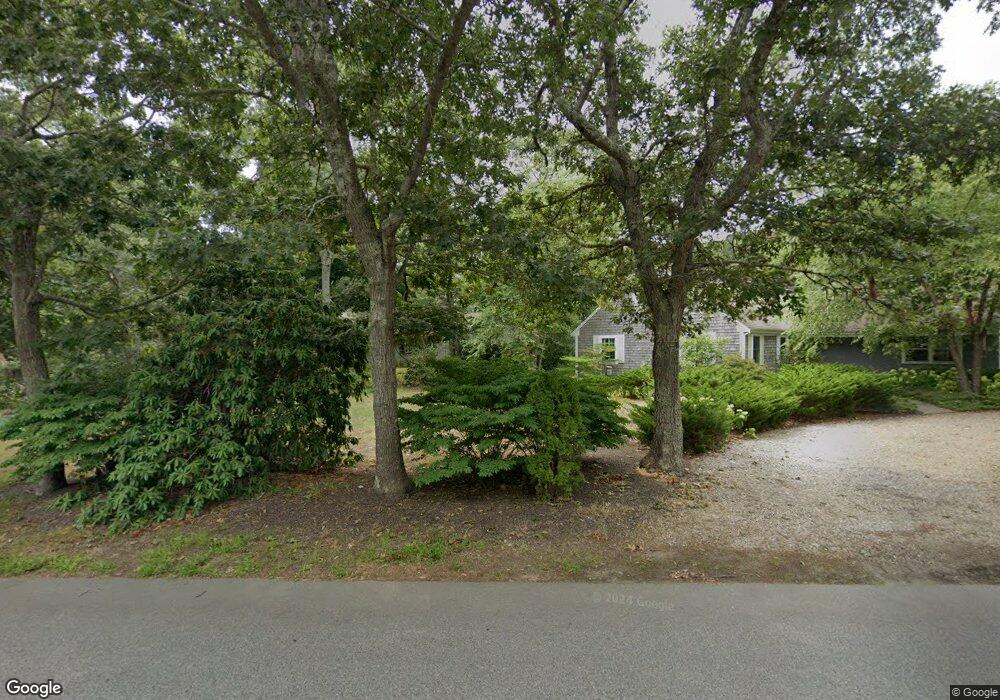
2115 Nauset Rd Eastham, MA 02642
Estimated Value: $727,000 - $872,000
4
Beds
3
Baths
1,903
Sq Ft
$424/Sq Ft
Est. Value
About This Home
This home is located at 2115 Nauset Rd, Eastham, MA 02642 and is currently estimated at $806,733, approximately $423 per square foot. 2115 Nauset Rd is a home located in Barnstable County with nearby schools including Eastham Elementary School, Nauset Regional Middle School, and Nauset Regional High School.
Ownership History
Date
Name
Owned For
Owner Type
Purchase Details
Closed on
Feb 27, 2009
Sold by
Keefe Monica E and Hess Wendell R
Bought by
Keefe-Hess Monica E and Hess Wendell R
Current Estimated Value
Home Financials for this Owner
Home Financials are based on the most recent Mortgage that was taken out on this home.
Original Mortgage
$239,000
Outstanding Balance
$150,921
Interest Rate
5%
Mortgage Type
Purchase Money Mortgage
Estimated Equity
$655,812
Purchase Details
Closed on
Aug 7, 2008
Sold by
Keefe Mary A
Bought by
Keefe Monica E and Hess Wendell R
Home Financials for this Owner
Home Financials are based on the most recent Mortgage that was taken out on this home.
Original Mortgage
$240,000
Interest Rate
6.49%
Mortgage Type
Purchase Money Mortgage
Purchase Details
Closed on
Nov 7, 1997
Sold by
Est Condon Margaret and Mcdowell-May Laura
Bought by
Keefe Mary A
Create a Home Valuation Report for This Property
The Home Valuation Report is an in-depth analysis detailing your home's value as well as a comparison with similar homes in the area
Home Values in the Area
Average Home Value in this Area
Purchase History
| Date | Buyer | Sale Price | Title Company |
|---|---|---|---|
| Keefe-Hess Monica E | -- | -- | |
| Keefe Monica E | $320,000 | -- | |
| Keefe Mary A | $11,475 | -- |
Source: Public Records
Mortgage History
| Date | Status | Borrower | Loan Amount |
|---|---|---|---|
| Open | Keefe Mary A | $40,000 | |
| Open | Keefe-Hess Monica E | $239,000 | |
| Previous Owner | Keefe Monica E | $240,000 | |
| Previous Owner | Keefe Mary A | $79,600 |
Source: Public Records
Tax History Compared to Growth
Tax History
| Year | Tax Paid | Tax Assessment Tax Assessment Total Assessment is a certain percentage of the fair market value that is determined by local assessors to be the total taxable value of land and additions on the property. | Land | Improvement |
|---|---|---|---|---|
| 2025 | $5,113 | $663,200 | $290,000 | $373,200 |
| 2024 | $4,514 | $644,000 | $281,600 | $362,400 |
| 2023 | $4,138 | $571,500 | $260,700 | $310,800 |
| 2022 | $3,714 | $432,900 | $209,500 | $223,400 |
| 2021 | $3,611 | $393,400 | $190,400 | $203,000 |
| 2020 | $3,353 | $384,500 | $194,400 | $190,100 |
| 2019 | $11,703 | $373,400 | $188,700 | $184,700 |
| 2018 | $81 | $362,600 | $183,200 | $179,400 |
| 2017 | $2,808 | $355,500 | $179,600 | $175,900 |
| 2016 | $2,771 | $372,500 | $199,600 | $172,900 |
| 2015 | $2,582 | $363,700 | $195,700 | $168,000 |
Source: Public Records
Map
Nearby Homes
- 1895 Nauset Rd
- 115 Sparrowhawk Ln
- 10 Hoyer Ln Unit A
- 390 Brackett Rd
- 100 Thoreau Dr
- 72 Dory Ln
- 35 Old County Rd Unit 1
- 95 Toland Dr
- 160 Toland Dr
- 255 Massasoit Rd
- 5470 State Hwy
- 65 Cestaro Way
- 60 Briggs Field Rd
- 45 Starlight Ln
- 100 Gigi Ln
- 10 Alston Ct
- 495 Aspinet Rd
- 135 Nauset Light Beach Rd
- 50 Silver Oak Rd
- 70 Deerfield Ln
- 2145 Nauset Rd
- 2055 Nauset Rd
- 2045 Nauset Rd
- 15 Farm View Rd
- 35 Farm View Ln
- 35 Queen Anne Dr
- 2130 Nauset Rd
- 30 Lighthouse Ln
- 40 Lighthouse Ln
- 20 Lighthouse Ln
- 35 Diane Dr
- 35 Diane Dr Unit 1&2
- 35 Diane Dr Unit A
- 35 Farm View Rd
- 50 Lighthouse Ln
- 515 Queen Ann
- 30 Queen Anne Dr
- 10 Lighthouse Ln
- 580 Queen Anne Dr
- 565 Queen Anne Dr