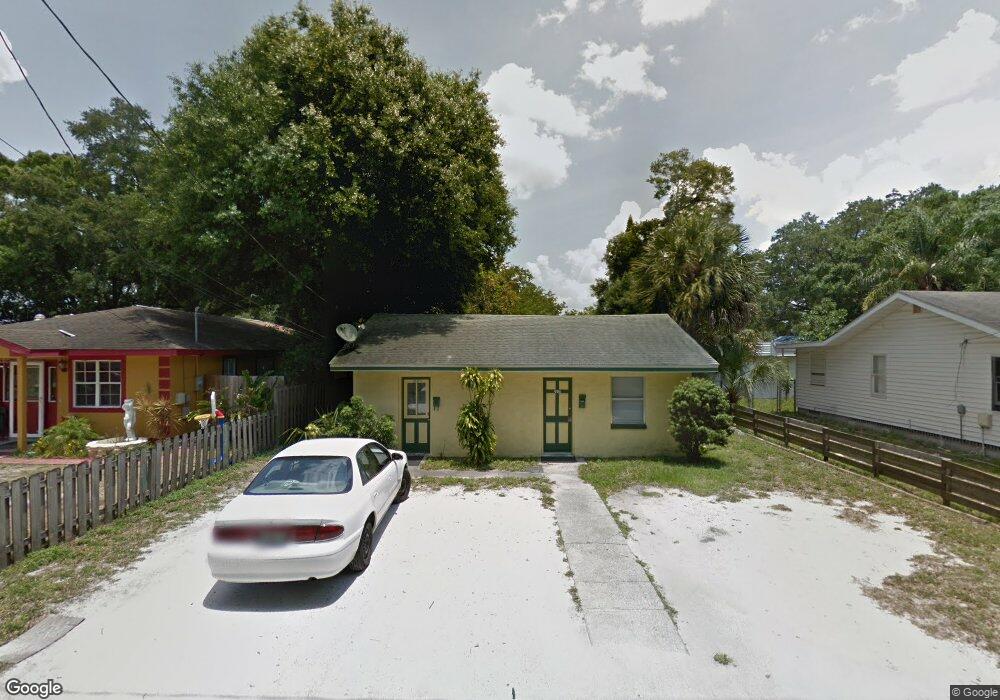
2117 11th St W Bradenton, FL 34205
Central Bradenton NeighborhoodEstimated Value: $243,558 - $378,000
2
Beds
2
Baths
1,072
Sq Ft
$265/Sq Ft
Est. Value
About This Home
This home is located at 2117 11th St W, Bradenton, FL 34205 and is currently estimated at $284,140, approximately $265 per square foot. 2117 11th St W is a home located in Manatee County with nearby schools including Jessie P. Miller Elementary School, Martha B. King Middle School, and Southeast High School.
Ownership History
Date
Name
Owned For
Owner Type
Purchase Details
Closed on
Feb 25, 2025
Sold by
Packer Alexander R and Loje Karen Lisdbeth
Bought by
Lcp Headway Llc
Current Estimated Value
Purchase Details
Closed on
Jul 27, 2022
Sold by
Marc Mailloux
Bought by
Packer Alexander R
Home Financials for this Owner
Home Financials are based on the most recent Mortgage that was taken out on this home.
Original Mortgage
$112,500
Interest Rate
5.78%
Mortgage Type
New Conventional
Purchase Details
Closed on
Mar 17, 2017
Sold by
Watson Stanley Frank
Bought by
Mailloux Mare
Home Financials for this Owner
Home Financials are based on the most recent Mortgage that was taken out on this home.
Original Mortgage
$75,000
Interest Rate
4.17%
Mortgage Type
Balloon
Create a Home Valuation Report for This Property
The Home Valuation Report is an in-depth analysis detailing your home's value as well as a comparison with similar homes in the area
Home Values in the Area
Average Home Value in this Area
Purchase History
| Date | Buyer | Sale Price | Title Company |
|---|---|---|---|
| Lcp Headway Llc | $110,400 | None Listed On Document | |
| Packer Alexander R | $150,000 | None Listed On Document | |
| Mailloux Mare | $52,500 | Equity National Title Llc |
Source: Public Records
Mortgage History
| Date | Status | Borrower | Loan Amount |
|---|---|---|---|
| Previous Owner | Packer Alexander R | $112,500 | |
| Previous Owner | Mailloux Mare | $75,000 |
Source: Public Records
Tax History
| Year | Tax Paid | Tax Assessment Tax Assessment Total Assessment is a certain percentage of the fair market value that is determined by local assessors to be the total taxable value of land and additions on the property. | Land | Improvement |
|---|---|---|---|---|
| 2025 | $2,708 | $146,628 | $50,150 | $96,478 |
| 2024 | $2,708 | $146,628 | $50,150 | $96,478 |
| 2023 | $2,728 | $144,560 | $40,800 | $103,760 |
| 2022 | $2,009 | $124,164 | $40,000 | $84,164 |
| 2021 | $1,641 | $87,015 | $25,000 | $62,015 |
| 2020 | $1,662 | $84,063 | $25,000 | $59,063 |
| 2019 | $1,591 | $82,380 | $25,000 | $57,380 |
| 2018 | $1,436 | $71,231 | $15,000 | $56,231 |
| 2017 | $1,197 | $63,800 | $0 | $0 |
| 2016 | $1,087 | $55,000 | $0 | $0 |
| 2015 | $1,052 | $53,550 | $0 | $0 |
| 2014 | $1,052 | $52,000 | $0 | $0 |
| 2013 | $1,119 | $54,715 | $7,350 | $47,365 |
Source: Public Records
Map
Nearby Homes
- 2105 11th St W
- 2011 11th St W
- 2005 12th St W
- 810 21st Ave W
- 810 20th Ave W
- 1408 22nd Ave W
- 702 20th Ave W
- 1411 21st Avenue Dr W
- 1416 19th Ave W
- 1110 27th Ave W
- 1503 23rd Ave W
- 1701 13th St W
- 1420 19th Ave W
- 1509 23rd Ave W
- 1512 23rd Ave W
- 1508 24th Avenue Dr W
- 1201, 1119, 1115 27th Ave W
- 609 25th Ave W
- 1501 25th Avenue Dr W
- 720 25th Ave W
- 2115 11th St W
- 2205 11th St W
- 2111 11th St W
- 2118 10th St W
- 2202 10th St W
- 2114 10th St W Unit 1
- 2207 11th St W
- 2206 10th St W
- 2120 11th St W
- 2116 11th St W
- 2104 10th St W
- 2112 11th St W
- 2206 11th St W
- 2101 11th St W
- 2210 10th St W
- 2219 11th St W
- 2106 11th St W
- 2102 10th St W
- 2212 11th St W
- 2214 10th St W
Your Personal Tour Guide
Ask me questions while you tour the home.