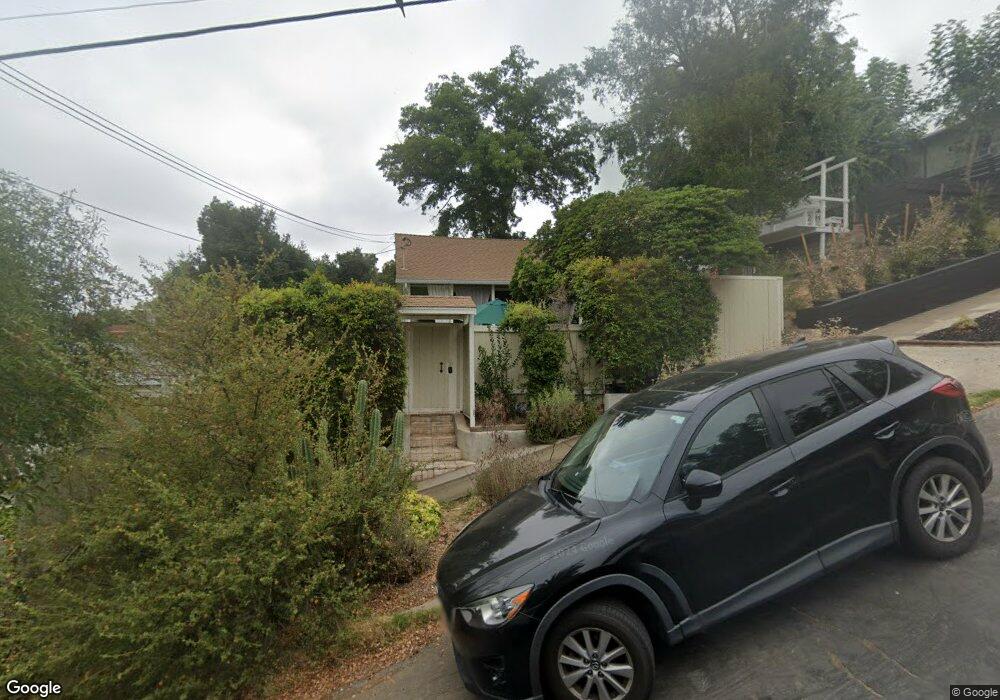
2117 Clifford St Los Angeles, CA 90026
Echo Park NeighborhoodEstimated Value: $900,000 - $1,018,000
3
Beds
1
Bath
768
Sq Ft
$1,243/Sq Ft
Est. Value
About This Home
This home is located at 2117 Clifford St, Los Angeles, CA 90026 and is currently estimated at $954,591, approximately $1,242 per square foot. 2117 Clifford St is a home located in Los Angeles County with nearby schools including Clifford Street Elementary School, Thomas Starr King Middle School Film and Media Magnet, and John Marshall Senior High.
Ownership History
Date
Name
Owned For
Owner Type
Purchase Details
Closed on
Feb 12, 2016
Sold by
Fong Stephen L
Bought by
Fong Stephen L and Alapy Esther K
Current Estimated Value
Home Financials for this Owner
Home Financials are based on the most recent Mortgage that was taken out on this home.
Original Mortgage
$175,000
Outstanding Balance
$139,597
Interest Rate
3.97%
Mortgage Type
New Conventional
Estimated Equity
$814,994
Purchase Details
Closed on
May 22, 1995
Sold by
Federal Home Loan Mortgage Corporation
Bought by
Alapy Esther
Home Financials for this Owner
Home Financials are based on the most recent Mortgage that was taken out on this home.
Original Mortgage
$90,250
Interest Rate
8.37%
Purchase Details
Closed on
Jan 10, 1995
Sold by
Pilipina Jose D and Lee Elizabeth
Bought by
Federal Home Loan Mortgage Corporation
Create a Home Valuation Report for This Property
The Home Valuation Report is an in-depth analysis detailing your home's value as well as a comparison with similar homes in the area
Home Values in the Area
Average Home Value in this Area
Purchase History
| Date | Buyer | Sale Price | Title Company |
|---|---|---|---|
| Fong Stephen L | -- | Title365 Company | |
| Alapy Esther | $95,000 | World Title Company | |
| Federal Home Loan Mortgage Corporation | $97,000 | Stewart Title |
Source: Public Records
Mortgage History
| Date | Status | Borrower | Loan Amount |
|---|---|---|---|
| Open | Fong Stephen L | $175,000 | |
| Closed | Alapy Esther | $90,250 |
Source: Public Records
Tax History Compared to Growth
Tax History
| Year | Tax Paid | Tax Assessment Tax Assessment Total Assessment is a certain percentage of the fair market value that is determined by local assessors to be the total taxable value of land and additions on the property. | Land | Improvement |
|---|---|---|---|---|
| 2025 | $1,967 | $159,536 | $127,640 | $31,896 |
| 2024 | $1,967 | $156,409 | $125,138 | $31,271 |
| 2023 | $1,930 | $153,343 | $122,685 | $30,658 |
| 2022 | $1,840 | $150,337 | $120,280 | $30,057 |
| 2021 | $1,813 | $147,390 | $117,922 | $29,468 |
| 2019 | $1,758 | $143,020 | $114,425 | $28,595 |
| 2018 | $1,735 | $140,217 | $112,182 | $28,035 |
| 2016 | $1,649 | $134,775 | $107,827 | $26,948 |
| 2015 | $1,625 | $132,752 | $106,208 | $26,544 |
| 2014 | $1,639 | $130,153 | $104,128 | $26,025 |
Source: Public Records
Map
Nearby Homes
- 1882 N Alvarado St Unit 16
- 2123 Branden St
- 2126 Branden St
- 2132 Branden St
- 2205 Selig Dr
- 1942 Lake Shore Ave
- 2252 Aaron St
- 2016 Lake Shore Ave
- 2240 Ewing St
- 2121 Baxter St
- 2016 Lemoyne St
- 2007 Baxter St
- 2250 Fargo St
- 1956 Vestal Ave
- 2068 Cerro Gordo St
- 1915 Apex Ave
- 2124 Lake Shore Ave
- 1804 Echo Park Ave
- 1925 Berkeley Ave
- 2327 Ewing St
- 2111 Clifford St
- 2121 Clifford St
- 1843 N Alvarado St
- 1851 N Alvarado St
- 1831 N Alvarado St
- 2118 Duane St
- 1901 N Alvarado St
- 2112 Duane St
- 2122 Duane St
- 1907 N Alvarado St
- 1827 N Alvarado St
- 2116 Clifford St
- 2108 Duane St
- 2110 Clifford St
- 2122 Clifford St
- 2112 Clifford St
- 2128 Clifford St
- 1915 N Alvarado St
- 1821 N Alvarado St
- 2132 Clifford St