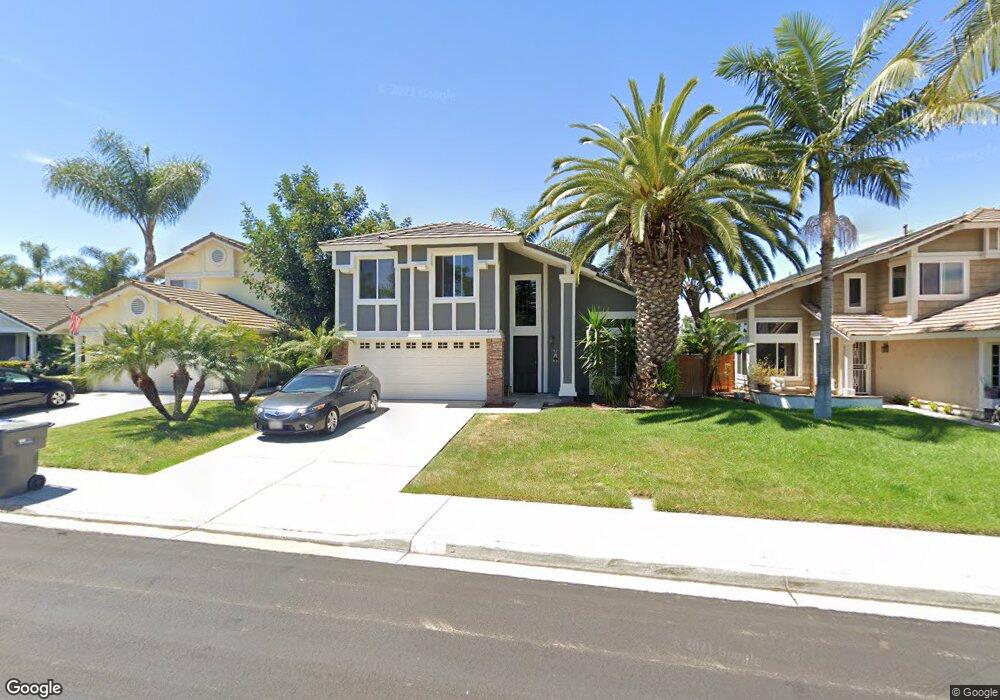
2117 Ramada Dr Oceanside, CA 92056
Mira Costa NeighborhoodEstimated Value: $888,302 - $951,000
3
Beds
3
Baths
1,717
Sq Ft
$533/Sq Ft
Est. Value
About This Home
This home is located at 2117 Ramada Dr, Oceanside, CA 92056 and is currently estimated at $914,326, approximately $532 per square foot. 2117 Ramada Dr is a home located in San Diego County with nearby schools including Christa McAuliffe Elementary School, Martin Luther King Jr. Middle School, and El Camino High School.
Ownership History
Date
Name
Owned For
Owner Type
Purchase Details
Closed on
Feb 4, 2002
Sold by
Schock Steven J
Bought by
Bakerink Brian C and Bakerink Clare M
Current Estimated Value
Home Financials for this Owner
Home Financials are based on the most recent Mortgage that was taken out on this home.
Original Mortgage
$273,600
Outstanding Balance
$97,539
Interest Rate
5.12%
Estimated Equity
$816,787
Purchase Details
Closed on
Aug 22, 1995
Sold by
Schock Margaret L
Bought by
Schock Steven J
Purchase Details
Closed on
Oct 14, 1993
Sold by
Schock Steven J
Bought by
Schock Steven J and Schock Margaret L
Home Financials for this Owner
Home Financials are based on the most recent Mortgage that was taken out on this home.
Original Mortgage
$138,400
Interest Rate
6.81%
Purchase Details
Closed on
Jul 14, 1989
Create a Home Valuation Report for This Property
The Home Valuation Report is an in-depth analysis detailing your home's value as well as a comparison with similar homes in the area
Home Values in the Area
Average Home Value in this Area
Purchase History
| Date | Buyer | Sale Price | Title Company |
|---|---|---|---|
| Bakerink Brian C | $288,500 | Equity Title | |
| Schock Steven J | -- | -- | |
| Schock Steven J | -- | South Coast Title Company | |
| Schock Steven J | -- | South Coast Title Company | |
| -- | $183,000 | -- |
Source: Public Records
Mortgage History
| Date | Status | Borrower | Loan Amount |
|---|---|---|---|
| Open | Bakerink Brian C | $273,600 | |
| Previous Owner | Schock Steven J | $138,400 |
Source: Public Records
Tax History
| Year | Tax Paid | Tax Assessment Tax Assessment Total Assessment is a certain percentage of the fair market value that is determined by local assessors to be the total taxable value of land and additions on the property. | Land | Improvement |
|---|---|---|---|---|
| 2025 | $5,081 | $425,439 | $177,264 | $248,175 |
| 2024 | $5,081 | $417,098 | $173,789 | $243,309 |
| 2023 | $4,937 | $408,921 | $170,382 | $238,539 |
| 2022 | $4,868 | $400,904 | $167,042 | $233,862 |
| 2021 | $4,884 | $393,044 | $163,767 | $229,277 |
| 2020 | $4,746 | $389,015 | $162,088 | $226,927 |
| 2019 | $4,620 | $381,388 | $158,910 | $222,478 |
| 2018 | $4,575 | $373,911 | $155,795 | $218,116 |
| 2017 | $71 | $366,581 | $152,741 | $213,840 |
| 2016 | $4,365 | $359,395 | $149,747 | $209,648 |
| 2015 | $4,250 | $353,997 | $147,498 | $206,499 |
| 2014 | $4,102 | $347,063 | $144,609 | $202,454 |
Source: Public Records
Map
Nearby Homes
- 2858 Lehigh Ct
- 3575 Cameo Dr Unit 43
- 2030 San Remo Dr
- 3531 Cameo Dr Unit 98
- 3795 Kelton Dr
- 2077 Tiffany Dr
- 2395 Rancho Del Oro Rd Unit 29
- 3376 Corsica Way
- 2335 Cartegena Way
- 3349 Par Dr
- 3599 Mcintire Cir
- 3335 Genoa Way Unit 112
- 3365 Genoa Way Unit 135
- 3315 Genoa Way Unit 96
- 3315 Tripoli Way
- 3328 Malta Way
- 3929 Marvin St
- 3529 Santa Maria St
- 3721 Magellan Cir
- 3225 Avenida de Loyola
- 2121 Ramada Dr
- 2113 Ramada Dr
- 2125 Ramada Dr
- 2109 Ramada Dr
- 2116 Madiera Dr
- 2112 Madiera Dr
- 2120 Madiera Dr
- 2108 Madiera Dr
- 2124 Madiera Dr
- 2129 Ramada Dr
- 2105 Ramada Dr
- 2104 Madiera Dr
- 2128 Madiera Dr
- 2116 Ramada Dr
- 2112 Ramada Dr
- 2133 Ramada Dr
- 2120 Ramada Dr
- 2110 Ramada Dr
- 2132 Madiera Dr
- 2124 Ramada Dr
Your Personal Tour Guide
Ask me questions while you tour the home.