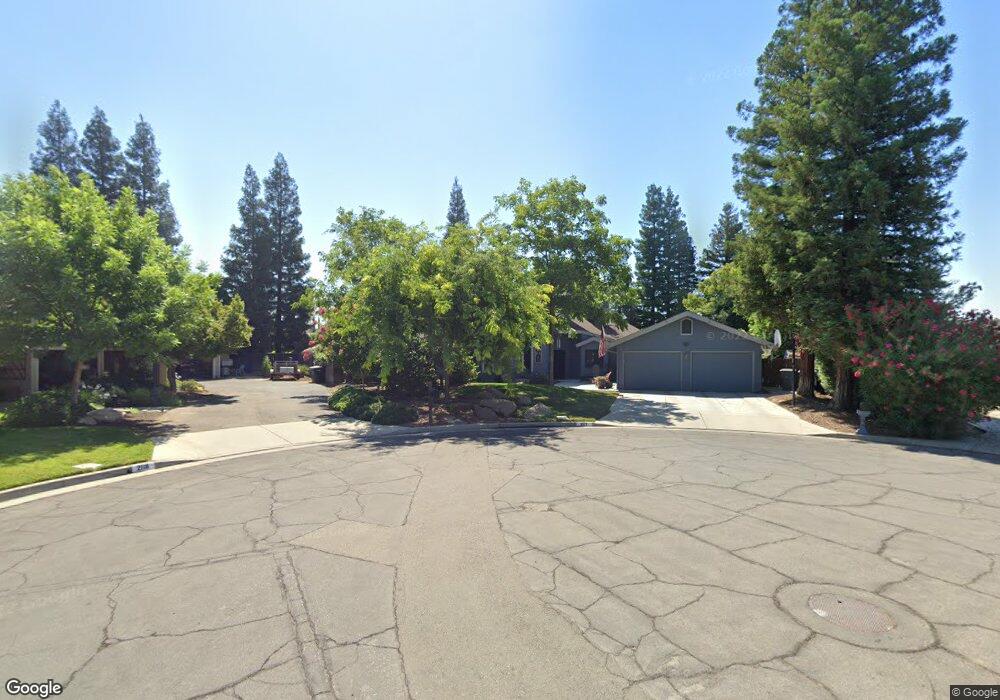
2117 W San Jose Ave Fresno, CA 93711
Van Ness Extension NeighborhoodEstimated Value: $661,000 - $724,665
4
Beds
3
Baths
2,785
Sq Ft
$248/Sq Ft
Est. Value
About This Home
This home is located at 2117 W San Jose Ave, Fresno, CA 93711 and is currently estimated at $690,666, approximately $247 per square foot. 2117 W San Jose Ave is a home located in Fresno County with nearby schools including Malloch Elementary School, Tenaya Middle School, and Bullard High School.
Ownership History
Date
Name
Owned For
Owner Type
Purchase Details
Closed on
Aug 10, 2021
Sold by
Gonzalez Edward C and Gonzalez Barbara G
Bought by
Gonzalez Edward C and Gonzalez Barbara G
Current Estimated Value
Purchase Details
Closed on
Apr 2, 2009
Sold by
Bush Andre J and Bush Dawna M
Bought by
Gonzalez Edward C and Gonzalez Barbara G
Home Financials for this Owner
Home Financials are based on the most recent Mortgage that was taken out on this home.
Original Mortgage
$275,000
Outstanding Balance
$175,980
Interest Rate
5.17%
Mortgage Type
Purchase Money Mortgage
Estimated Equity
$514,686
Purchase Details
Closed on
Dec 30, 2003
Sold by
Shewan Scott R and Shewan Celsa L
Bought by
Bush Andre J and Bush Dawna M
Home Financials for this Owner
Home Financials are based on the most recent Mortgage that was taken out on this home.
Original Mortgage
$100,000
Interest Rate
5.85%
Mortgage Type
Purchase Money Mortgage
Purchase Details
Closed on
Jul 29, 1994
Sold by
Shewan Celsa L
Bought by
Shewan Celsa L and Bush Andre J
Create a Home Valuation Report for This Property
The Home Valuation Report is an in-depth analysis detailing your home's value as well as a comparison with similar homes in the area
Home Values in the Area
Average Home Value in this Area
Purchase History
| Date | Buyer | Sale Price | Title Company |
|---|---|---|---|
| Gonzalez Edward C | -- | None Available | |
| Gonzalez Edward C | $375,000 | Placer Title Company | |
| Bush Andre J | $285,000 | Stewart Title Of Fresno Cnty | |
| Shewan Celsa L | -- | -- |
Source: Public Records
Mortgage History
| Date | Status | Borrower | Loan Amount |
|---|---|---|---|
| Open | Gonzalez Edward C | $275,000 | |
| Previous Owner | Bush Andre J | $100,000 |
Source: Public Records
Tax History Compared to Growth
Tax History
| Year | Tax Paid | Tax Assessment Tax Assessment Total Assessment is a certain percentage of the fair market value that is determined by local assessors to be the total taxable value of land and additions on the property. | Land | Improvement |
|---|---|---|---|---|
| 2025 | $5,935 | $482,903 | $141,648 | $341,255 |
| 2023 | $5,819 | $464,153 | $136,149 | $328,004 |
| 2022 | $5,738 | $455,053 | $133,480 | $321,573 |
| 2021 | $5,578 | $446,131 | $130,863 | $315,268 |
| 2020 | $5,553 | $441,558 | $129,522 | $312,036 |
| 2019 | $5,337 | $432,901 | $126,983 | $305,918 |
| 2018 | $5,219 | $424,414 | $124,494 | $299,920 |
| 2017 | $5,128 | $416,093 | $122,053 | $294,040 |
| 2016 | $4,956 | $407,932 | $119,659 | $288,273 |
| 2015 | $4,813 | $396,400 | $116,300 | $280,100 |
| 2014 | $4,505 | $371,200 | $108,900 | $262,300 |
Source: Public Records
Map
Nearby Homes
- 2190 W Via Cipressi
- 5125 N Via Amore
- 5088 N Forkner Ave
- 5072 N Forkner Ave
- 5124 N Via Trevi
- 2044 W San Bruno Ave
- 2059 W Barstow Ave
- 5375 N Forkner Ave
- 5287 N Sequoia Dr
- 5180 N Channing Way
- 1720 W Barstow Ave
- 4914 N Sequoia Dr
- 1582 W San Jose Ave
- 1685 W Robinwood Ln
- 1110 W Fairmont Ave
- 4908 N Sequoia Ave Unit 102
- 4880 N Hulbert Ave Unit 101
- 5039 N Van Ness Blvd
- 4848 N Hulbert Ave Unit 102
- 2013 W Fairmont Ave
- 5215 N Via Amore
- 5205 N Via Amore
- 2127 W San Jose Ave
- 2118 W San Jose Ave
- 2122 W Via Cipressi
- 5195 N Via Amore
- 5225 N Via Amore
- 2130 W Via Cipressi
- 5185 N Via Amore
- 2138 W Via Cipressi
- 2126 W San Jose Ave
- 2081 W Via Frassino
- 2114 W Via Cipressi
- 2090 W Via Frassino
- 2145 W San Jose Ave
- 5175 N Via Amore
- 2146 W Via Cipressi
- 2069 W Via Frassino
- 2068 W Via Lante
- 2109 W San Bruno Ave