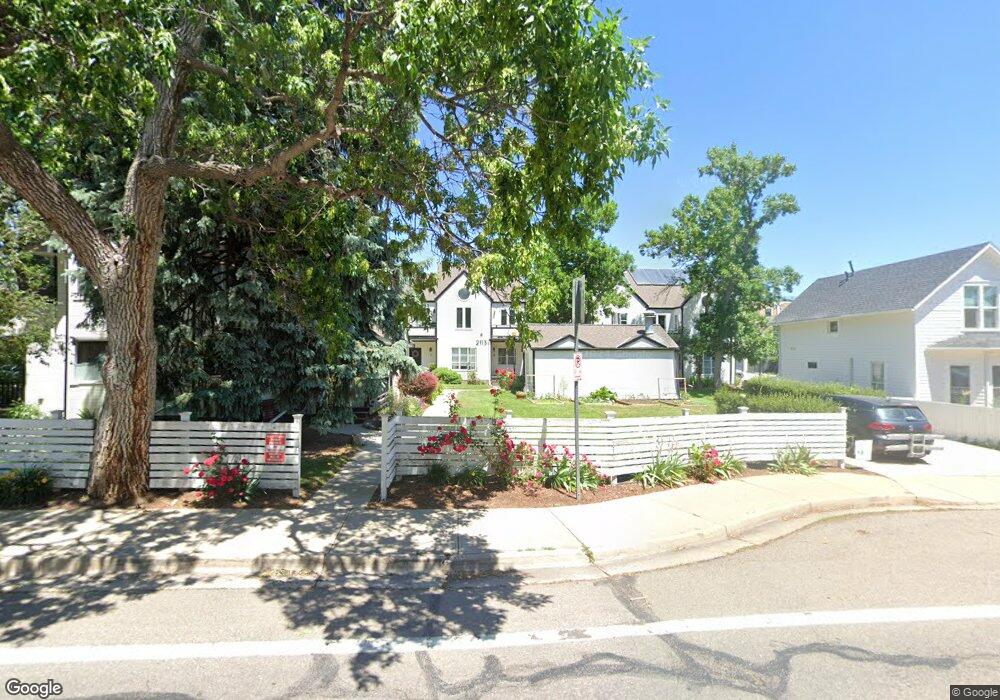
2117 Walnut St Unit 13C Boulder, CO 80302
Whittier NeighborhoodEstimated Value: $643,000 - $733,000
2
Beds
2
Baths
858
Sq Ft
$810/Sq Ft
Est. Value
About This Home
This home is located at 2117 Walnut St Unit 13C, Boulder, CO 80302 and is currently estimated at $694,902, approximately $809 per square foot. 2117 Walnut St Unit 13C is a home located in Boulder County with nearby schools including Whittier Elementary School, Casey Middle School, and Boulder High School.
Ownership History
Date
Name
Owned For
Owner Type
Purchase Details
Closed on
Mar 15, 1996
Sold by
Gapinski Albert George
Bought by
Hattenback White Barbara A
Current Estimated Value
Home Financials for this Owner
Home Financials are based on the most recent Mortgage that was taken out on this home.
Original Mortgage
$127,700
Interest Rate
7.62%
Purchase Details
Closed on
Sep 27, 1994
Sold by
Carney Jonas T
Bought by
Gapinski Albert George
Home Financials for this Owner
Home Financials are based on the most recent Mortgage that was taken out on this home.
Original Mortgage
$107,200
Interest Rate
8.45%
Purchase Details
Closed on
Feb 3, 1992
Bought by
Hattenback-White Barbara A
Purchase Details
Closed on
Jun 24, 1985
Bought by
Hattenback-White Barbara A
Create a Home Valuation Report for This Property
The Home Valuation Report is an in-depth analysis detailing your home's value as well as a comparison with similar homes in the area
Home Values in the Area
Average Home Value in this Area
Purchase History
| Date | Buyer | Sale Price | Title Company |
|---|---|---|---|
| Hattenback White Barbara A | $141,900 | Commonwealth Land Title | |
| Gapinski Albert George | $134,000 | -- | |
| Hattenback-White Barbara A | $78,000 | -- | |
| Hattenback-White Barbara A | $77,500 | -- |
Source: Public Records
Mortgage History
| Date | Status | Borrower | Loan Amount |
|---|---|---|---|
| Closed | Hattenback White Barbara A | $127,700 | |
| Previous Owner | Gapinski Albert George | $107,200 |
Source: Public Records
Tax History Compared to Growth
Tax History
| Year | Tax Paid | Tax Assessment Tax Assessment Total Assessment is a certain percentage of the fair market value that is determined by local assessors to be the total taxable value of land and additions on the property. | Land | Improvement |
|---|---|---|---|---|
| 2025 | $3,669 | $44,463 | -- | $44,463 |
| 2024 | $3,669 | $44,463 | -- | $44,463 |
| 2023 | $3,605 | $41,749 | -- | $45,434 |
| 2022 | $3,612 | $38,899 | $0 | $38,899 |
| 2021 | $3,445 | $40,019 | $0 | $40,019 |
| 2020 | $3,126 | $35,914 | $0 | $35,914 |
| 2019 | $3,078 | $35,914 | $0 | $35,914 |
| 2018 | $2,542 | $29,318 | $0 | $29,318 |
| 2017 | $2,462 | $32,413 | $0 | $32,413 |
| 2016 | $2,153 | $24,875 | $0 | $24,875 |
| 2015 | $2,039 | $21,341 | $0 | $21,341 |
| 2014 | $1,835 | $21,341 | $0 | $21,341 |
Source: Public Records
Map
Nearby Homes
- 2201 Pearl St Unit 224
- 2201 Pearl St Unit 2
- 2304 Pearl St Unit 2
- 1916 23rd St
- 2336 Spruce St Unit 5
- 1934 18th St Unit 14
- 1945 Canyon Blvd
- 2227 Canyon Blvd Unit 253B
- 2227 Canyon Blvd Unit 363B
- 2227 Canyon Blvd Unit 261B
- 2227 Canyon Blvd Unit 359B
- 2227 Canyon Blvd Unit 458B
- 2227 Canyon Blvd Unit 306A
- 2025 18th St
- 1707 Walnut St Unit 203
- 1707 Walnut St Unit 307
- 1707 Walnut St Unit 208
- 1707 Walnut St Unit 308
- 1707 Walnut St Unit 101
- 1707 Walnut St Unit 207
- 2117 Walnut St Unit 12C
- 2117 Walnut St Unit 11C
- 2117 Walnut St Unit 10C
- 2117 Walnut St Unit C
- 2113 Walnut St Unit 9B
- 2113 Walnut St Unit 8B
- 2113 Walnut St Unit 7B
- 2113 Walnut St Unit 6B
- 2113 Walnut St Unit 5B
- 2113 Walnut St Unit 5
- 2113 Walnut St Unit 9
- 2113 Walnut St Unit B
- 2113 Walnut St Unit 8
- 2105 Walnut St Unit 3A
- 2105 Walnut St Unit 2A
- 2105 Walnut St Unit 1A
- 2105 Walnut St Unit 4A
- 2105 Walnut St Unit A
- 2105 Walnut St Unit 3
- 2121 Walnut St