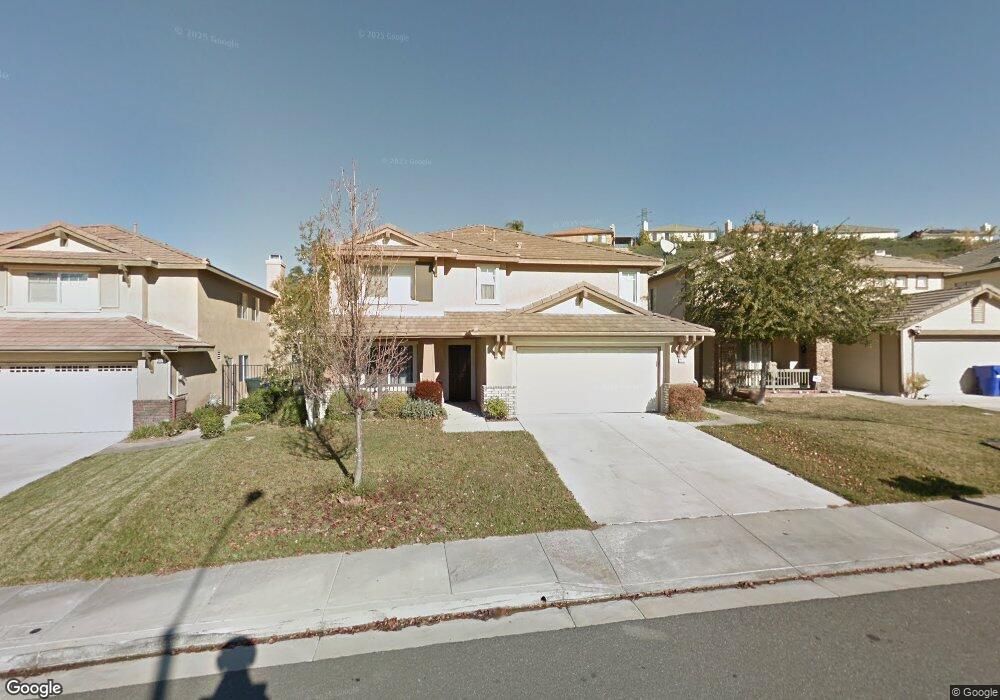
21171 Lone Star Way Santa Clarita, CA 91390
Saugus NeighborhoodEstimated Value: $1,052,182 - $1,182,000
5
Beds
3
Baths
3,253
Sq Ft
$338/Sq Ft
Est. Value
About This Home
This home is located at 21171 Lone Star Way, Santa Clarita, CA 91390 and is currently estimated at $1,101,046, approximately $338 per square foot. 21171 Lone Star Way is a home located in Los Angeles County with nearby schools including James Foster Elementary School, Arroyo Seco Junior High School, and Saugus High School.
Ownership History
Date
Name
Owned For
Owner Type
Purchase Details
Closed on
Nov 19, 2012
Sold by
Kayne Lauren Kay
Bought by
Kayne Lauren K and Lauren K Kayne Trust
Current Estimated Value
Home Financials for this Owner
Home Financials are based on the most recent Mortgage that was taken out on this home.
Original Mortgage
$221,000
Outstanding Balance
$39,117
Interest Rate
3.33%
Mortgage Type
New Conventional
Estimated Equity
$1,061,929
Purchase Details
Closed on
Oct 12, 2007
Sold by
Kayne Lauren Kay and Kayne Arthur
Bought by
Kayne Lauren K and Lauren K Kayne Trust
Purchase Details
Closed on
Sep 22, 2004
Sold by
Kayne Arthur and Kayne Lauren Kay
Bought by
Kayne Arthur and Kayne Lauren Kay
Purchase Details
Closed on
Sep 6, 2002
Sold by
Haskell Canyon Ranch Llc
Bought by
Kayne Arthur and Kayne Lauren K
Home Financials for this Owner
Home Financials are based on the most recent Mortgage that was taken out on this home.
Original Mortgage
$264,900
Interest Rate
6.37%
Create a Home Valuation Report for This Property
The Home Valuation Report is an in-depth analysis detailing your home's value as well as a comparison with similar homes in the area
Home Values in the Area
Average Home Value in this Area
Purchase History
| Date | Buyer | Sale Price | Title Company |
|---|---|---|---|
| Kayne Lauren K | -- | Accommodation | |
| Kayne Lauren Kay | -- | Title 365 | |
| Kayne Lauren K | -- | None Available | |
| Kayne Arthur | -- | -- | |
| Kayne Arthur | $340,000 | Orange Coast Title |
Source: Public Records
Mortgage History
| Date | Status | Borrower | Loan Amount |
|---|---|---|---|
| Open | Kayne Lauren Kay | $221,000 | |
| Previous Owner | Kayne Arthur | $264,900 |
Source: Public Records
Tax History Compared to Growth
Tax History
| Year | Tax Paid | Tax Assessment Tax Assessment Total Assessment is a certain percentage of the fair market value that is determined by local assessors to be the total taxable value of land and additions on the property. | Land | Improvement |
|---|---|---|---|---|
| 2025 | $8,814 | $495,538 | $205,799 | $289,739 |
| 2024 | $8,814 | $485,822 | $201,764 | $284,058 |
| 2023 | $8,531 | $476,297 | $197,808 | $278,489 |
| 2022 | $8,556 | $466,959 | $193,930 | $273,029 |
| 2021 | $8,432 | $457,804 | $190,128 | $267,676 |
| 2019 | $8,211 | $444,228 | $184,490 | $259,738 |
| 2018 | $8,063 | $435,519 | $180,873 | $254,646 |
| 2016 | $7,666 | $418,608 | $173,850 | $244,758 |
| 2015 | $7,439 | $412,321 | $171,239 | $241,082 |
| 2014 | $7,355 | $404,245 | $167,885 | $236,360 |
Source: Public Records
Map
Nearby Homes
- 21163 Lone Star Way
- 21240 Lone Star Way
- 28652 Deer Springs Dr
- 21103 Cross Creek Dr
- 21553 Oak Dr Unit 115
- 21558 Oak Dr Unit 78
- 20818 Benz Rd
- 20643 Calhaven Dr
- 28303 Sycamore Dr
- 28412 Rock Canyon Dr
- 28744 Haskell Canyon Rd
- 20746 Franwood Dr
- 21626 Glen Canyon Place
- 28410 Agajanian Dr
- 21756 Redwood Canyon Place
- 20623 Russ Jay St
- 28647 Visco Ct
- 28760 Mauch St
- 28804 Sugar Bliss Place
- 28723 Park Woodland Place
- 21167 Lone Star Way
- 21179 Lone Star Way
- 28516 Old Coach Ct
- 28510 Old Coach Ct
- 21156 Cimarron Way
- 21160 Cimarron Way
- 21155 Lone Star Way
- 28504 Old Coach Ct
- 28522 Old Coach Ct
- 21152 Cimarron Way
- 21164 Cimarron Way
- 21149 Lone Star Way
- 28528 Old Coach Ct
- 21148 Cimarron Way
- 21168 Cimarron Way
- 21142 Cimarron Way
- 28534 Old Coach Ct
- 21174 Lone Star Way
- 21143 Lone Star Way
- 21180 Lone Star Way