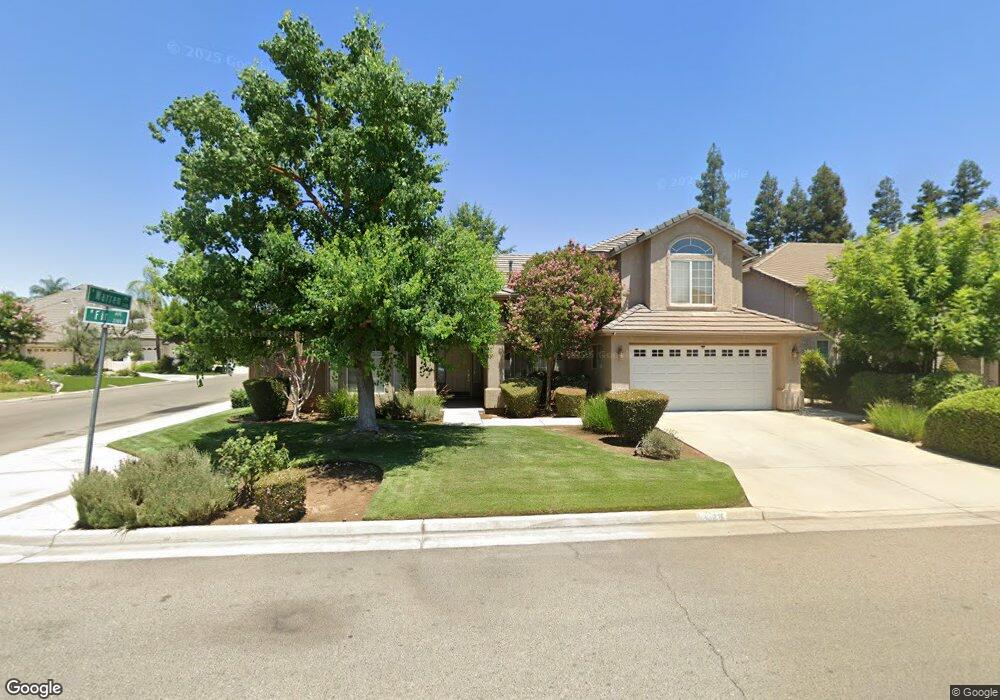
2118 W Fir Ave Fresno, CA 93711
Van Ness Extension NeighborhoodEstimated Value: $659,000 - $705,000
4
Beds
3
Baths
2,697
Sq Ft
$252/Sq Ft
Est. Value
About This Home
This home is located at 2118 W Fir Ave, Fresno, CA 93711 and is currently estimated at $679,360, approximately $251 per square foot. 2118 W Fir Ave is a home located in Fresno County with nearby schools including Nelson Elementary School, Kastner Intermediate School, and Clovis West High School.
Ownership History
Date
Name
Owned For
Owner Type
Purchase Details
Closed on
Nov 10, 2011
Sold by
Papaleo Vincent S and Papaleo Pamela Swearingen
Bought by
Obata Christine
Current Estimated Value
Home Financials for this Owner
Home Financials are based on the most recent Mortgage that was taken out on this home.
Original Mortgage
$299,250
Outstanding Balance
$204,453
Interest Rate
4.06%
Mortgage Type
New Conventional
Estimated Equity
$474,907
Purchase Details
Closed on
Aug 6, 1997
Sold by
Assemi Development Inc
Bought by
Papaleo Vincent S and Papaleo Pamela Swearingen
Home Financials for this Owner
Home Financials are based on the most recent Mortgage that was taken out on this home.
Original Mortgage
$170,500
Interest Rate
7.57%
Create a Home Valuation Report for This Property
The Home Valuation Report is an in-depth analysis detailing your home's value as well as a comparison with similar homes in the area
Home Values in the Area
Average Home Value in this Area
Purchase History
| Date | Buyer | Sale Price | Title Company |
|---|---|---|---|
| Obata Christine | $315,000 | Chicago Title Company | |
| Papaleo Vincent S | $213,500 | Central Title Company |
Source: Public Records
Mortgage History
| Date | Status | Borrower | Loan Amount |
|---|---|---|---|
| Open | Obata Christine | $299,250 | |
| Previous Owner | Papaleo Vincent S | $170,500 |
Source: Public Records
Tax History Compared to Growth
Tax History
| Year | Tax Paid | Tax Assessment Tax Assessment Total Assessment is a certain percentage of the fair market value that is determined by local assessors to be the total taxable value of land and additions on the property. | Land | Improvement |
|---|---|---|---|---|
| 2025 | $4,654 | $395,648 | $118,692 | $276,956 |
| 2023 | $4,564 | $380,286 | $114,084 | $266,202 |
| 2022 | $4,502 | $372,831 | $111,848 | $260,983 |
| 2021 | $4,375 | $365,521 | $109,655 | $255,866 |
| 2020 | $4,357 | $361,774 | $108,531 | $253,243 |
| 2019 | $4,271 | $354,681 | $106,403 | $248,278 |
| 2018 | $4,177 | $347,727 | $104,317 | $243,410 |
| 2017 | $4,104 | $340,910 | $102,272 | $238,638 |
| 2016 | $3,966 | $334,226 | $100,267 | $233,959 |
| 2015 | $3,905 | $329,206 | $98,761 | $230,445 |
| 2014 | $3,829 | $322,758 | $96,827 | $225,931 |
Source: Public Records
Map
Nearby Homes
- 6743 N Dolores Ave
- 2290 W Atlanta Ave
- 7258 N Channing Way
- 7047 N Teilman Ave Unit 101
- 7047 N Teilman Ave Unit 102
- 6670 N Sequoia Ave
- 6660 N St Catherine Ct
- 6671 N Channing Way
- 6753 N Durant Ave
- 2246 W Palo Alto Ave
- 2284 W Palo Alto Ave
- 2473 W Beechwood Ave
- 7334 N Teilman Ave
- 6779 N Woodson Ave
- 6518 N Dolores Ave
- 7355 N Pacific Ave
- 2589 W Lake van Ness Cir
- 6569 N Teilman Ave
- 2571 W Magill Ave
- 2555 W Bluff Ave Unit 152
- 2106 W Fir Ave
- 2098 W Fir Ave
- 2117 W Spruce Ave
- 7141 N Warren Ave
- 2101 W Spruce Ave
- 7125 N Warren Ave
- 2119 W Fir Ave
- 2107 W Fir Ave
- 7161 N Warren Ave
- 2094 W Fir Ave
- 7119 N Warren Ave
- 2101 W Fir Ave
- 2095 W Spruce Ave
- 2086 W Fir Ave
- 2095 W Fir Ave
- 7095 N Warren Ave
- 7142 N Bengston Ave
- 7163 N Warren Ave
- 7088 N Warren Ave
- 7156 N Bengston Ave