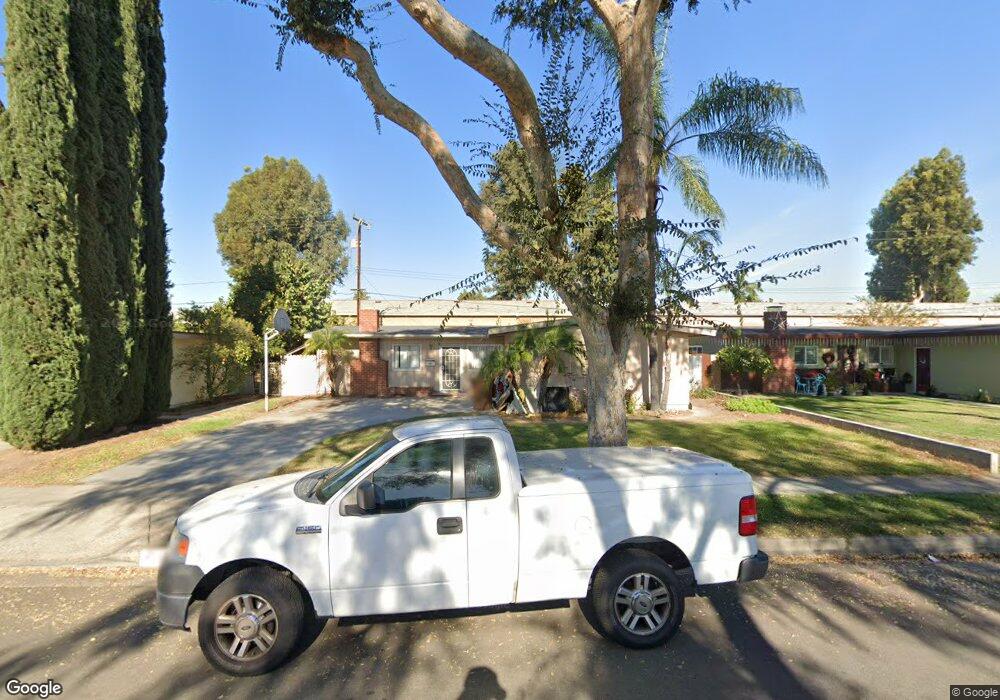
2119 Carol Dr Fullerton, CA 92833
Estimated Value: $817,424 - $885,000
3
Beds
2
Baths
1,196
Sq Ft
$719/Sq Ft
Est. Value
About This Home
This home is located at 2119 Carol Dr, Fullerton, CA 92833 and is currently estimated at $860,356, approximately $719 per square foot. 2119 Carol Dr is a home located in Orange County with nearby schools including Pacific Drive Elementary School, Nicolas Junior High School, and Buena Park High School.
Ownership History
Date
Name
Owned For
Owner Type
Purchase Details
Closed on
Feb 20, 2001
Sold by
Dowell Eric and Dowell Mary
Bought by
Lucatero Mario T and Lopez Victoria
Current Estimated Value
Home Financials for this Owner
Home Financials are based on the most recent Mortgage that was taken out on this home.
Original Mortgage
$211,678
Outstanding Balance
$75,832
Interest Rate
6.97%
Mortgage Type
FHA
Estimated Equity
$784,524
Purchase Details
Closed on
Nov 13, 1997
Sold by
Mcdonald John L
Bought by
Dowell Eric and Dowell Mary
Home Financials for this Owner
Home Financials are based on the most recent Mortgage that was taken out on this home.
Original Mortgage
$149,387
Interest Rate
7.16%
Mortgage Type
FHA
Purchase Details
Closed on
Mar 21, 1994
Sold by
Mcdonald Lisa M
Bought by
Mcdonald John L
Home Financials for this Owner
Home Financials are based on the most recent Mortgage that was taken out on this home.
Original Mortgage
$138,100
Interest Rate
8.6%
Create a Home Valuation Report for This Property
The Home Valuation Report is an in-depth analysis detailing your home's value as well as a comparison with similar homes in the area
Purchase History
| Date | Buyer | Sale Price | Title Company |
|---|---|---|---|
| Lucatero Mario T | $215,000 | Benefit Land Title Company | |
| Dowell Eric | $152,000 | North American Title Co | |
| Mcdonald John L | -- | Gateway Title Company |
Source: Public Records
Mortgage History
| Date | Status | Borrower | Loan Amount |
|---|---|---|---|
| Open | Lucatero Mario T | $211,678 | |
| Previous Owner | Dowell Eric | $149,387 | |
| Previous Owner | Mcdonald John L | $138,100 |
Source: Public Records
Tax History
| Year | Tax Paid | Tax Assessment Tax Assessment Total Assessment is a certain percentage of the fair market value that is determined by local assessors to be the total taxable value of land and additions on the property. | Land | Improvement |
|---|---|---|---|---|
| 2025 | $3,780 | $323,960 | $258,664 | $65,296 |
| 2024 | $3,780 | $317,608 | $253,592 | $64,016 |
| 2023 | $3,687 | $311,381 | $248,620 | $62,761 |
| 2022 | $3,659 | $305,276 | $243,745 | $61,531 |
| 2021 | $3,597 | $299,291 | $238,966 | $60,325 |
| 2020 | $3,576 | $296,223 | $236,516 | $59,707 |
| 2019 | $3,488 | $290,415 | $231,878 | $58,537 |
| 2018 | $3,436 | $284,721 | $227,331 | $57,390 |
| 2017 | $3,379 | $279,139 | $222,874 | $56,265 |
| 2016 | $3,311 | $273,666 | $218,504 | $55,162 |
| 2015 | $3,221 | $269,556 | $215,222 | $54,334 |
| 2014 | $3,129 | $264,276 | $211,006 | $53,270 |
Source: Public Records
Map
Nearby Homes
- 2321 Williamson Ave
- 401 S Gilbert St
- 2009 W Oak Ave
- 2404 W Ash Ave
- 134 S Pritchard Ave
- 3515 W Commonwealth Ave
- 3604 W Valencia Dr
- 801 S Courtney Ave
- 1836 W Southgate Ave
- 804 Creekside Dr Unit 56
- 674 Bridgeport Cir Unit 25
- 2410 W Orangethorpe Ave Unit 6
- 2523 Cypress Point Dr
- 4014 W Commonwealth Ave
- 904 Whitewater Dr Unit 6
- 2426 Plaza de Vista
- 921 Creekside Dr Unit 131
- 1850 W Orangethorpe Ave Unit 24
- 1850 W Orangethorpe Ave Unit 44
- 926 Whitewater Dr Unit 96
Your Personal Tour Guide
Ask me questions while you tour the home.