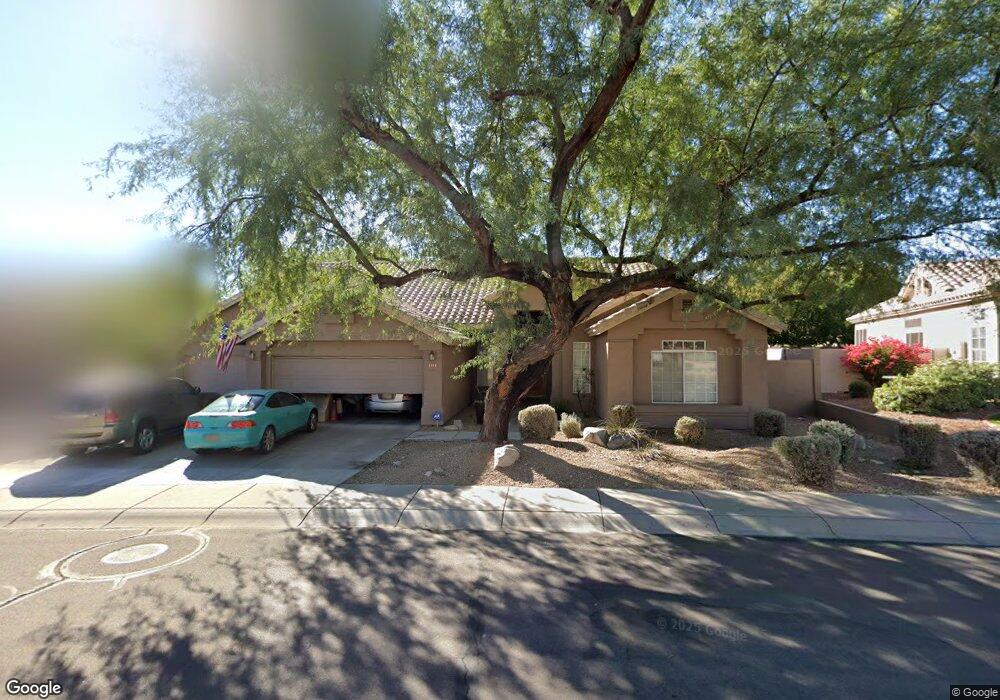
2119 E Taxidea Way Phoenix, AZ 85048
Ahwatukee NeighborhoodEstimated Value: $753,881 - $931,000
--
Bed
4
Baths
2,873
Sq Ft
$298/Sq Ft
Est. Value
About This Home
This home is located at 2119 E Taxidea Way, Phoenix, AZ 85048 and is currently estimated at $856,720, approximately $298 per square foot. 2119 E Taxidea Way is a home located in Maricopa County with nearby schools including Kyrene Monte Vista Elementary School, Kyrene Altadeña Middle School, and Desert Vista High School.
Ownership History
Date
Name
Owned For
Owner Type
Purchase Details
Closed on
Oct 18, 2010
Sold by
Gealer Charles A and Gealer Vivian R
Bought by
Gealer Charles A and Gealer Vivian R
Current Estimated Value
Purchase Details
Closed on
Nov 15, 2002
Sold by
Gealer Charles A and Gealer Vivian R
Bought by
Gealer Charles A and Gealer Vivian R
Home Financials for this Owner
Home Financials are based on the most recent Mortgage that was taken out on this home.
Original Mortgage
$175,900
Outstanding Balance
$73,297
Interest Rate
5.95%
Estimated Equity
$783,423
Purchase Details
Closed on
Dec 13, 2000
Sold by
Marsh Candee
Bought by
Gealer Charles A and Gealer Vivian R
Create a Home Valuation Report for This Property
The Home Valuation Report is an in-depth analysis detailing your home's value as well as a comparison with similar homes in the area
Home Values in the Area
Average Home Value in this Area
Purchase History
| Date | Buyer | Sale Price | Title Company |
|---|---|---|---|
| Gealer Charles A | -- | Pioneer Title Agency Inc | |
| Gealer Charles A | -- | Pioneer Title Agency Inc | |
| Gealer Charles A | -- | Security Title Agency | |
| Gealer Charles A | -- | Security Title Agency | |
| Gealer Charles A | -- | -- | |
| Marsh Candee | -- | -- | |
| Gealer Charles A | -- | -- |
Source: Public Records
Mortgage History
| Date | Status | Borrower | Loan Amount |
|---|---|---|---|
| Open | Gealer Charles A | $175,900 |
Source: Public Records
Tax History
| Year | Tax Paid | Tax Assessment Tax Assessment Total Assessment is a certain percentage of the fair market value that is determined by local assessors to be the total taxable value of land and additions on the property. | Land | Improvement |
|---|---|---|---|---|
| 2025 | $4,431 | $47,806 | -- | -- |
| 2024 | $4,196 | $45,529 | -- | -- |
| 2023 | $4,196 | $57,170 | $11,430 | $45,740 |
| 2022 | $3,992 | $43,100 | $8,620 | $34,480 |
| 2021 | $4,109 | $39,330 | $7,860 | $31,470 |
| 2020 | $4,082 | $38,560 | $7,710 | $30,850 |
| 2019 | $3,943 | $36,310 | $7,260 | $29,050 |
| 2018 | $3,856 | $35,550 | $7,110 | $28,440 |
| 2017 | $3,669 | $35,280 | $7,050 | $28,230 |
| 2016 | $3,705 | $34,430 | $6,880 | $27,550 |
| 2015 | $3,296 | $34,850 | $6,970 | $27,880 |
Source: Public Records
Map
Nearby Homes
- 2139 E Tecoma Rd Unit 35G2
- 14644 S 24th Place
- 1805 E Rocky Slope Dr
- 2451 E Indigo Brush Rd
- 15432 S 21st Place
- 15431 S 22nd St
- 14004 S 19th Place Unit 22
- 1744 E Desert Willow Dr
- 2134 E Barkwood Rd Unit 20
- 2115 E Barkwood Rd Unit 23
- 2451 E Dry Creek Rd
- 1726 E Desert Willow Dr Unit 7
- 1849 E Windmere Dr
- 14651 S 25th Place
- 1682 E Desert Willow Dr Unit 4
- 1915 E Muirwood Dr
- 15840 S 22nd St Unit 39
- 15844 S 23rd Place
- 15055 S 14th Place
- 13811 S Canyon Dr
- 2113 E Taxidea Way
- 2125 E Taxidea Way
- 2110 E Indigo Brush Rd Unit 35G1
- 2102 E Indigo Brush Rd
- 2118 E Indigo Brush Rd
- 2107 E Taxidea Way
- 2131 E Taxidea Way
- 2114 E Taxidea Way
- 2126 E Indigo Brush Rd
- 2044 E Indigo Brush Rd Unit 35G1
- 14652 S Foxtail Ln
- 2101 E Taxidea Way
- 2036 E Indigo Brush Rd
- 2110 E Taxidea Way
- 2107 E Indigo Brush Rd
- 2113 E Indigo Brush Rd
- 2102 E Taxidea Way
- 14644 S Foxtail Ln
- 2101 E Indigo Brush Rd
- 2119 E Indigo Brush Rd
Your Personal Tour Guide
Ask me questions while you tour the home.